Threatened and Endangered Species Geodatabases
The Threatened and Endangered Species geodatabases (T&E geodatabases) are a new Environmental Sensitivity Index (ESI) product that allows ESI users to quickly and easily see where threatened or endangered species exist in the U.S. at various times during the year. These geodatabases contain a subset of the coastal species mapped in the original ESI data for each region. The T&E geodatabases focus on the coastal species and habitats that are listed by federal or state governments as endangered, threatened, protected, or as a species of concern.
The ESI data are complex by nature, so it can be difficult for those who use the ESI data intermittently to quickly extract the information they need. These T&E geodatabases will offer a more user-friendly option to access some of the more critical biological information for a region.
Downloading the T&E Geodatabases
Download T&E geodatabases: From this page, you can download T&E geodatabases for atlases produced prior to 2014. For atlases updated after that date, the T&E reflects the prior atlas data.
What the T&E Geodatabases Provide
The T&E data are provided in a personal geodatabase format (.mdb). In addition, a map document (.mxd) and separate layer files are available, which replicate the standard ESI symbology and contain links to the supplemental data tables. Each geodatabase corresponds in coverage to an original ESI atlas and contains individual species layers (feature classes), along with the land/water interface (hydro layer) for geographic reference.
The Map Document
| Piping plover |  |
| Shortnose sturgeon |  |
| Eastern mud turtle |  |
| Seabeach amaranth |  |
For each atlas, the map document (.mxd) incorporates all of the T&E species data. These documents, for use in Esri's ArcMap software, use all of the standard ESI colors and hatch patterns to display the species on the map.
In an example from the Long Island ESI atlas, below, colored/hatched polygons indicate the presence of threatened/endangered species (piping plover, shortnose sturgeon, Eastern mud turtle, and seabeach amaranth) in Great South Bay in the month of June.
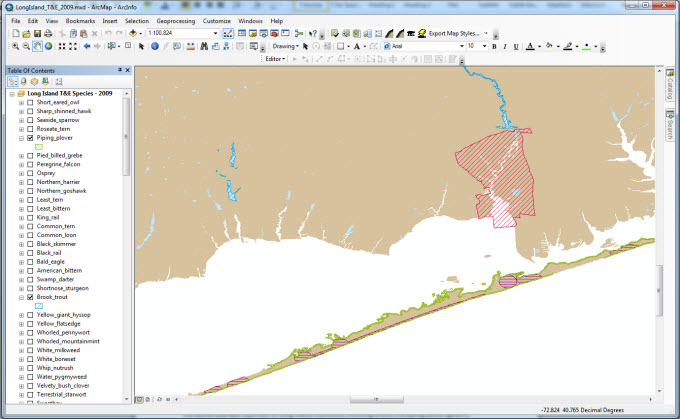
The table of contents, shown in the left panel, lists all the T&E species found in the Long Island ESI atlas. At the top of the list, in bold, is the data frame name: Long Island T&E Species – 2009. Because the threatened/endangered listing status is dynamic, each map document and data frame name includes the year the atlas was published. As always, it is important to remember that the ESI data are a "snapshot in time." The publication year is also included in each record of the feature attribute table, shown below.
Feature Attribute Tables
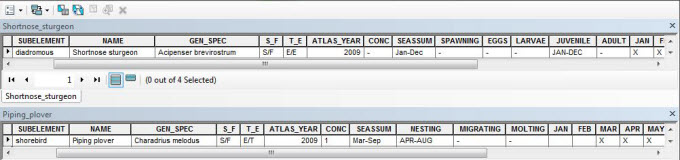
The feature attribute tables include all of the basic information associated with each species polygon, point, or line on the map. This information is included for the T&E species:
- the species' subelement—an ESI grouping of species with similar habitat preferences and feeding styles (e.g., shorebird is a subelement of the bird element)
- common name (e.g., Piping plover)
- genus and species (e.g., Charadrius melodus)
- threatened/endangered status (e.g., state endangered, federally threatened)
- atlas publication date, which provides a general guide to the listing date
- the species' concentration or abundance, provided (if available) as a number, a range of numbers, or a quantitative or qualitative approximation, such as "100s" or "few"
- seasonal presence (e.g., present March through September)
- life history summaries (e.g., nesting April through August)
Also included in the feature attribute tables are month fields, which simplify searching for the presence of a species in a particular month or season.
Supplementary Tables
Three related tables are available, if more information is needed:
- sources table
- breed_dt table
- ThreatenedEndangered table
These tables provide the user with the ability to search within a species for monthly breeding activities and information about the original data source.
Using the T&E Data in other Ways
In addition to the ArcMap T&E documents available, the T&E data can easily be brought into existing map projects, such as contingency planning maps. Layer files are available that include the symbology, and links are established to the three supplementary tables if they are added to the ArcMap data frame. In the near future, these data will also be available within NOAA's online mapping tool, ERMA, and as a separate map service. These additional products will bring ESI data to many users who lack access to Esri's ArcMap.
More Information about ESI Mapping
Environmental Sensitivity Index (ESI) Maps: Read an overview of ESI maps.
Anatomy of ESI Maps: Here is an introduction to the basic elements of ESI maps, including the types of information that are mapped.
ESI Format Types: Learn about the other formats in which ESI maps and data are available.
ESI Availability: See the regions that have been mapped and available formats.
Questions: Contact us with questions, comments, or suggestions about the T&E geodatabases.