Arctic Tracer Release Experiment
OR&R’s Spatial Data Branch (SDB) worked with the University of Alaska Fairbanks’ (UAF) Arctic Tracer Release Experiment (ARCTREX): Applications for Mapping Spilled Oil in Arctic Waters.
This experiment is part of the larger Chukchi & Western Beaufort Circulation Study, which is a Bureau of Ocean Energy Management-sponsored project (AK NSL 12-03). The purpose of the Circulation Study is to examine the physical oceanography of the NE Chukchi shelf and exchanges between the northeast Chukchi and the western Beaufort shelves and the adjacent basin. As part of this study, the ARCTREX experiment is simulating a small oil spill in the Chukhi Sea using Rhodamine dye. The experiment tests the ability of currently available technologies and web-based Geographic Information Systems (GIS) to collect and provide real time data and maps for Response awareness and planning.
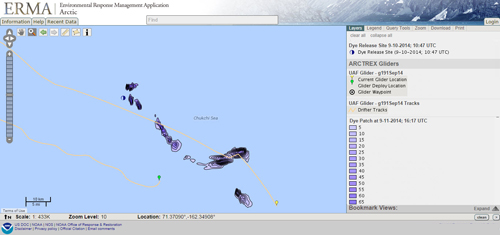
All data collected and mapped during this experiment are being displayed using Arctic ERMA. Arctic ERMA provides a web-based mapping solution, which is available to anyone who has access to an Internet connection. This allows the data to be shared with a wide audience. SDB personnel created a bookmark ( UAF ARCTREX Study (Sept 2014)) for access to the experiment specific data. Various data types are being displayed in Arctic ERMA. They include Drifter and Glider tracks and points and Rhodamine dye patches. The Drifter and Glider data are being pulled into Artic ERMA as real-time data feeds from the UAF servers. This means that the data in Arctic ERMA are automatically updated as new data become available. The user has a real-time picture of the current location of these sampling instruments. Rhodamine dye patches were sent to OR&R directly from the field collection team, who uploaded the data to Arctic ERMA. The dye patches each had a date and time stamp, which allows for the creation of an animation. The animation shows the location and concentration of a dye patch at a given date and time. The user is able to step through the entire animation and see how the dye patch moved and the concentrations changed over time.
Being able to ingest and serve out real-time data showing the locations of sampling equipment and dye patches allows for a better operational picture in the event of a Response. ERMA is able to accomplish this with a variety of data formats and types.
For additional information, contact Nicolas.Eckhardt@noaa.gov or Amy.Merten@noaa.gov.
Go back to OR&R Weekly Report.

