NOAA Launches New Hurricane Story Map Following Hurricanes Irma, Harvey and Maria
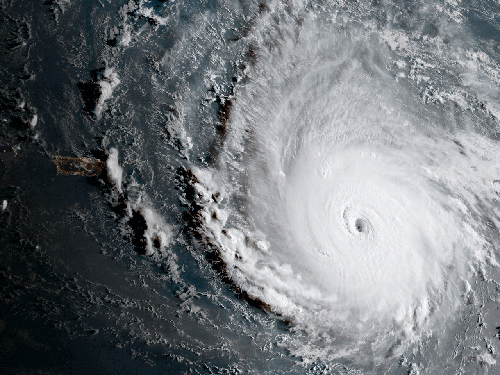
OCT. 12, 2017 — In an update on the 2017 hurricane season in August, NOAA announced the likelihood for an above-normal hurricane season. With Hurricane Harvey came a new record for the wettest tropical system in the continental U.S. and shortly after, the Category 5 Hurricane Irma broke yet another record, becoming the strongest Atlantic Ocean hurricane.

To detail some of the new technology and practices that have supported hurricane response this season, NOAA recently launched a new hurricane story map.
“History is being made this season. New satellites, modeling tools and other new technology, and a revamped institutional philosophy designed to build a Weather-Ready Nation, amount to a complete change in how NOAA prepares our country and our communities for hurricanes,” said Louis W. Uccellini, director of the National Weather Service, during an interview with The Atlantic.
NOAA’s new and emerging technology, such as a Geostationary Lightning Mapper(GLM), GOES-16’s Advanced Baseline Imager and the experimental HRRRX, a real-time, hourly updated severe weather model, provided more detailed maps and images of these storm systems resulting in earlier warnings and better impact predictions.
These new tools not only helped with forecasting and mapping these storm systems, but also helped in monitoring and responding to possible oil spills and hazardous leaks using applications such as ERMA® (Environmental Response Management Application), a regionally-tailored mapping tool.
Some of NOAA’s new tools this season were also available to the public, including the new Storm Tracker App, where users can follow severe weather storms as they develop.
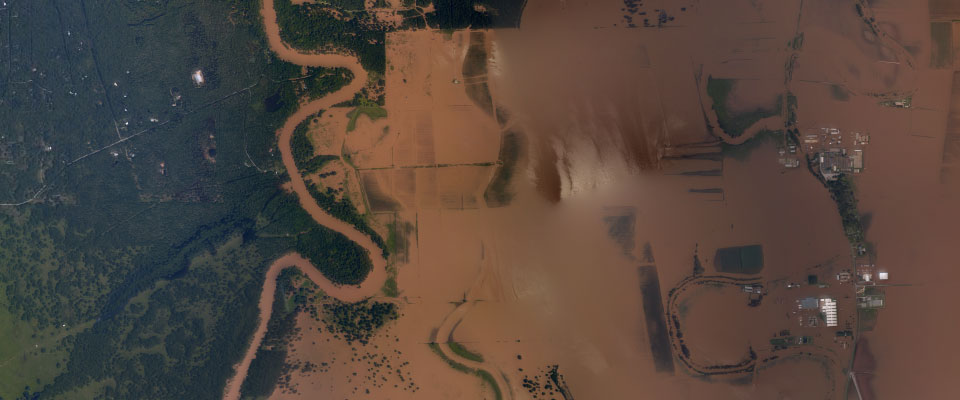
This hurricane season those affected can also request aerial images collected by NOAA’s National Geodetic Survey to help assess the hurricane-related damage. For hurricanes Harvey and Irma alone, there have been 1.7 billion requests for these images.
For videos, images and more information on the tools and resources NOAA is using this hurricane season, please view the full story map here.
To stay up to date on storm activity, including Tropical Storm Ophelia, check out the new Storm Tracker App here.


