Adventures in Developing Tools for Oil Spill Response in the Arctic
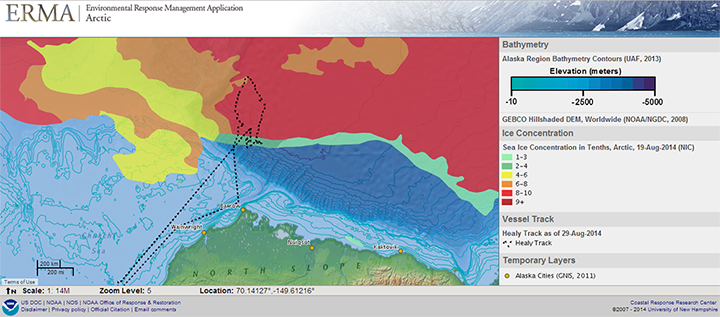
SEPTEMBER 11, 2014 -- The Arctic Ocean, sea ice, climate change, polar bears—each evokes a vivid image in the mind. Now what is the most vivid image that comes to mind as you read the word "interoperability"? It might be the backs of your now-drooping eyelids, but framed in the context of oil spill response, "interoperability" couldn't be more important. NOAA Geographic Information Systems (GIS) specialists Jill Bodnar and Zachary Winters-Staszak have just finished working with the U.S. Coast Guard Research and Development Center on an Arctic Technology Evaluation during Arctic Shield 2014. They were investigating the interoperability of potential oil spill response technologies while aboard the Coast Guard icebreaker Healy on the Arctic Ocean.
Putting Square Pegs in Round Holes
As GIS map specialists for NOAA's Office of Response and Restoration, a great deal of Bodnar and Winters-Staszak's time is spent transforming raw data into a visual map product that can quickly be understood. Their team achieves this in large part by developing a versatile quiver of tools tailored to meet specific needs. For example, think of a toddler steadfastly—and vainly—trying to shove that toy blue cylinder into a yellow box through a triangular hole. This would be even more difficult if there were no circular hole on that box, but imagine if instead you could create a tool to change those cylinders to fit through any hole you needed. With computer programming languages they can create interoperability between technologies, allowing them to work together more easily. That cylinder can now go through the triangular hole.
New School, New Tools
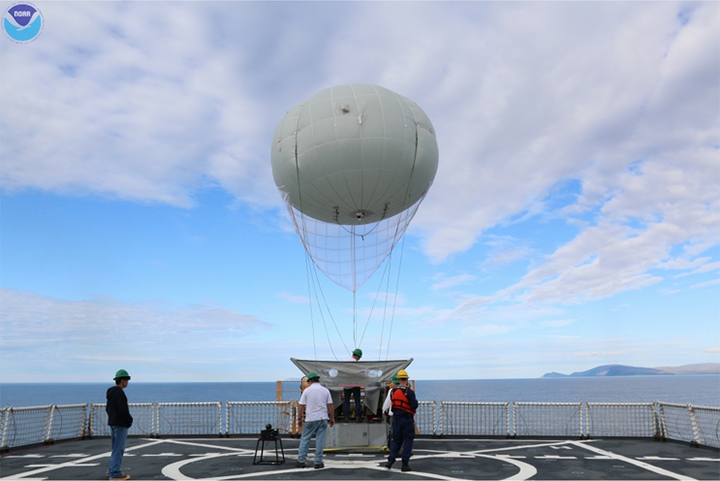
Different technologies are demonstrated each year during the Arctic Shield exercises and it is common for each technology to have a different format or output, requiring them to be standardized before anyone can use them in a GIS program like NOAA's Environmental Response Management Application, Arctic ERMA. Taking lessons learned from Arctic Shield 2013, the two came prepared with tools in ERMA that would allow them to automate the process and increase their efficiency. They demonstrated these tools during the "oil spill in ice" component of the demonstration. Here, fluorescein dye simulated an oil plume drifting across the water surface and oranges bobbed along as simulated oiled targets. The first new tool allowed them to convert data recorded by the Puma, a remote-controlled aircraft run by NOAA's Unmanned Aircraft Systems Program. This allowed them to associate the Puma's location with the images it was taking precisely at those coordinates and display them together in ERMA. The Puma proved useful in capturing high resolution imagery during the demonstration. A similar tool was created for the Aerostat, a helium-filled balloon connected to a tether on the ship, which can create images and real-time video with that can track targets up to three miles away. This technology also was able to delineate the green dye plume in the ocean below—a function that could be used to support oil spill trajectory modeling. They could then make these images appear on a map in ERMA.

The third tool received email notifications from floating buoys provided by the Oil Spill Recovery Institute and updated their location in ERMA every half hour. These buoys are incredibly rugged and produced useful data that could be used to track oiled ice floes or local surface currents over time. Each of the tools they brought with them is adaptable to changes on the fly, making them highly valuable in the event of an actual oil spill response.
Internet: Working With or Without You
Having the appropriate tools in place for the situation at hand is vital to any response, let alone a response in the challenging conditions of the Arctic. One major challenge is a lack of high-speed Internet connectivity. While efficient satellite connectivity does exist for simple communication such as text-based email, a robust pipeline to transmit and receive megabytes of data is costly to maintain. Similar to last year's expedition, the NOAA team overcame this hurdle by using Stand-alone ERMA, the Internet-independent version of the site that was available to Healy researchers through the ship's internal network. This year the team took a large step forward and successfully tested a new tool in ERMA that uses the limited Internet connectivity to upload small packages (less than 5 megabytes) of new data on the Stand-alone ERMA site to the live Arctic ERMA site. This provided updates of the day’s Arctic field activities to NOAA staff back home. During an actual oil spill, this tool would provide important information to decision-makers and stakeholders at a command post back on land and at agency headquarters around the country.

Every Experience Is a Learning Experience
This is not to say everything went as planned during these ventures through the Arctic Ocean. Arctic weather conditions lived up to their reputation this year, with fog, winds, and white-cap seas delaying and preventing a large portion of the demonstration. (This was even during the region's relatively calm, balmy summer months.) Subsequently, limited data and observations were produced—a sobering exercise for some researchers. Here, we have described only a few of the technologies demonstrated during this exercise, but there were unexpected issues with almost every technology; one was even rendered inoperable after being crushed between two ice floes. In addition, troubleshooting data and human errors added to an already full day of work. Yet every hardship allowed those aboard the Healy to learn, reassess, adapt, and move forward with their work. The capacity of human ingenuity and the tools they can create will be tested to their limits as NOAA and our partners continue to prepare for an oil spill response in the harsh and unpredictable environs of the Arctic. The ability to operate in these conditions will be essential to protecting the local communities, wildlife, and coastal habitats of the region. The data generated will help inform crucial and rapid decisions by resource managers, making interoperability along with efficient data management and dissemination fundamental to effective environmental response. Editor's note: Use Twitter to chat directly with NOAA GIS specialists Zachary Winters-Staszak and Jill Bodnar about their experience during this Arctic oil spill simulation aboard an icebreaker on Thursday, September 18 at 2:00 p.m. Eastern. Follow the conversation at #ArcticShield14 and get the details: http://response.restoration.noaa.gov/about/media/tweetchat-preparing-arctic-oil-spills.html. This is the third in a series of posts about the Arctic Technology Evaluation supporting Arctic Shield 2014. Read the first post, "NOAA Again Joins Coast Guard for Oil Spill Exercise in the Arctic" and the second post, "Overcoming the Biggest Hurdle During an Oil Spill in the Arctic: Logistics." Check out photos from their time aboard the U.S. Coast Guard Cutter Healy.

 An official website of the United States government.