Frequently Asked Questions (FAQs) about CAFE
Here are answers to basic user questions about CAFE, grouped by the following topics.
- CAFE Basics
- Fate Module
- Effects (Toxicity) Module
- Species Sensitivity Distributions (SSDs)
CAFE Basics
Q. How can I get CAFE?
A. There are two ways to use CAFE. (1) You can use the latest version, Web CAFE or (2) You can download the desktop version of CAFE (both Windows and Mac versions available) and follow the on-screen instructions to install it.
Q. How much does CAFE cost?
A. CAFE is free, as are the other software programs offered by the Emergency Response Division of NOAA OR&R.
Q. What is the latest version of CAFE?
A. The latest Web version is Web CAFE 2.0 (January 2020). The latest desktop version of CAFE is 1.2 (June 2016).
Q. How often will CAFE be updated?
A. The data in Web CAFE will be updated annually. Let us know your ideas and suggestions to improve CAFE.
Q. What browsers are compatible with Web CAFE?
A. Web CAFE has been tested on the following browsers: Safari, Firefox, Chrome, Internet Explorer, and Edge.
Q. What computer operating systems are compatible with desktop CAFE?
A. You can install and run the desktop version of CAFE on Windows or Mac operating systems. CAFE for Windows can be run on Windows 7, 8, 8.1, and 10 operating systems. CAFE for Mac can be run on Mountain Lion (10.8), Mavericks (10.9), Yosemite (10.10), and El Capitan (10.11) operating systems. Operating systems not listed here have not been tested and are not supported.
Q. Is CAFE available for smartphones and tablets (such as iOS or Android devices)?
A. As a web-based application, Web CAFE can be used on any device with a browser (e.g., phone, tablet, laptop/desktop computer). That said, it was optimized for use on laptops or larger screens. Desktop CAFE is currently only available as a desktop program.
Q. Is there technical support for CAFE?
A. Web CAFE: The CAFE User Manual and How to Use CAFE document are embedded in the program. In addition, a link to contact the CAFE team is also provided at the bottom of each page.
Desktop CAFE: On the page, Getting Started with CAFE, we provide a number of resources to help you use CAFE, ranging from its basic use to detailed technical details. In addition, there are videos on a number of topics to help you get up and running. If you need further assistance, you can email the CAFE team at OR&R.
Q. What are the main components of CAFE?
A. The following table shows the main components of Web CAFE and their functions.
| Component | Function |
|---|---|
| Aquatic Fate | View fate information from three sub-modules: Structure and Description, Physical Properties, and Environmental Fate and Environmental Explanations. |
| Aquatic Effects (Toxicity) | View toxicity data for chemicals, oils, dispersants, and dispersant-oil mixtures |
| Short Exposure Risk Reports | View risk estimates for short exposure durations (1, 2, 4, or 8 hours) |
| MyChemicals / MyOilDispersants | Collect and compare generated SSD curves |
| Export | Export raw data used to generate SSD curves |
| ICE modeling | For chemicals, oils, or dispersants, add data to generate predictive SSD curves |
This table shows the main components of Desktop CAFE and their functions.
| Component | Function |
|---|---|
| Aquatic Fate | View fate information from three sub-modules: Structure and Physical Properties, Environmental Fate, and Analytical Methods and Uses for Chemicals |
| Aquatic Effects (Toxicity) | View toxicity data for chemicals, oils, dispersants, and dispersant-oil mixtures |
| User-Added Data | Add your own toxicity data to CAFE, and view, edit, import, export, or delete your data |
| Short Exposure Risk Reports | View risk estimates for short exposure durations (1, 2, 4, or 8 hours) |
In comparison, the two versions of CAFE offer the following components:
| Features | Web CAFE | Desktop CAFE |
|---|---|---|
| Requires download | No | Yes |
| Runs offline (without internet) | No | Yes |
| Add user-added data | No | Yes |
| Ability to Search | Yes | Yes |
| View Fate Module | Yes | Yes |
| Run Effects Scenario | Yes | Yes |
| View Short-Term Risk Reports | Yes | Yes |
| Access print-friendly layouts | Yes | Yes |
| Compare curves with MyChemicals or MyOilDispersants | Yes | No |
| Print Reports from MyChemicals or MyOilDispersants | Yes | No |
| Generate ICE Models | Yes | No |
| Export data | Yes | No |
| Mouse-over datapoints on SSD curves | Yes | No |
Q. What are the sources used in CAFE?
A. Fate sources include the SRC, Inc.'s PHYSPROP database, the National Library of Medicine’s HSDB data, and the EPA’s EPI Suite™. Primary sources for effects include the EPA’s ECOTOX database; the European database, ECETOC; Research Planning, Inc.’s DTox database, and peer-reviewed literature and reports.
Q. Who created CAFE?
A. CAFE was developed by NOAA’s Office of Response and Restoration, in collaboration with Research Planning, Inc.
Q. What kind of software is CAFE?
A. Web CAFE is a website (a port to the Web of the CAFE desktop application).
Desktop CAFE was created with FileMaker Pro®, a fully relational database program that allows us to bundle the chemical and oil data with the FileMaker Runtime engine.
Q. Where can I find more information about CAFE?
A. On the page, Getting Started with CAFE, we provide links to published technical papers that provide extensive detail about the development of CAFE.
Fate Module
Q. Where can I find the definitions of the physical properties?
A. Each physical property has a help button, ![]() , that provides its respective property.
, that provides its respective property.
Effects (Toxicity) Module
Q. What is Data Applicability?
A. Each toxicity data record (row) within CAFE was scored (e.g., high, moderate, low), based on its applicability to chemical spill response. This score was judged based on source-specific considerations. Refer to Appendix A of the CAFE User's Manual [PDF, 5.7 MB] for criteria.
Species Sensitivity Distributions (SSDs)
Q. What are Species Sensitivity Distributions (SSDs)?
A. SSDs are probabilistic models generated by ranking the relative sensitivity of individual species from most sensitive to least sensitive. In CAFE, SSDs are generated for datasets with a minimum of five species by fitting the empirical toxicity data to a logistic function, defined below, where L is the curve's maximum value, and a and c the regression coefficients:
![]()
Q. How do you read a SSD curve?
A. The X-axis represents the concentration required to adversely affect the aquatic species based on a logarithmic scale. The Y-axis represents the percentage of the affected species. Species located to the left of the curve are more sensitive than the species to the right of the curve.
Q. What is an HC1 or HC5 value?
A. The estimated HC1 and HC5 (µg/L) values are derived from an SSD curve and are used as hazard concentrations under the assumption that these would be protective of 99 percent and 95 percent of the species, respectively.
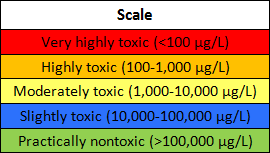
Q. What do the color codes mean?
A. The following color code scheme was adopted from the U.S. EPA Office of Pesticide Programs, representing a common scale of relative toxicity for aquatic organisms.
More questions, comments, or suggestions? Contact us.