 An official website of the United States government.
 Deepwater Horizon Trajectory Maps: Background
Beginning April 21, 2010, the modeling team at NOAA's Office of Response and Restoration (OR&R) began generating daily oil spill trajectories for the Deepwater Horizon oil spill, continuing this work for 107 days.
The trajectory maps were produced using GNOME, the spill trajectory model developed by OR&R's Emergency Response Division. The production of maps was discontinued August 23, 2010, after overflights and satellite analyses eventually showed no recoverable oil in the spill area.
The trajectory maps are available for download, grouped by date and by type, through the links in the navigation bar at the top of this page. As you view the maps, you may notice that some maps are titled "Mississippi Canyon 252," which is the oil and gas prospect block where the Deepwater Horizon drilling rig was located.
This page provides information about the types of maps that were produced, as well as publications written to help map users understand the oil trajectory maps.
Map Types
Different types of maps were produced during the response, based on the needs of the response team:
Cumulative Trajectory Maps: Cumulative trajectory maps were produced early in the Deepwater Horizon spill response. They showed on one map the surface location of spilled oil for several consecutive days, as well as a forecast for the following day. As the area of water affected by the spill grew larger, the forecast aspect of these maps became more important than the day-to-day changes in surface oil, so the next trajectory products included only forecasts. The cumulative maps were produced from April 26 through May 6 (except April 27), 2010.
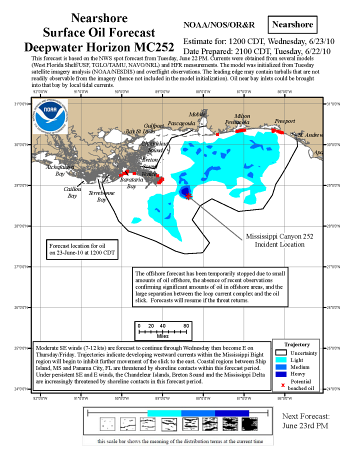
Nearshore Surface Oil Forecasts: Nearshore forecasts for 24 hours, 48 hours, and 72 hours were produced for surface oil in the nearshore (i.e., out to the continental slope, not typically affected by the Loop Current system) to support daily response planning. These forecasts continued to be produced until no recoverable oil was seen in overflights of the area for about three weeks. These maps were produced from April 30 through August 23, 2010.
Offshore Surface Oil Forecasts: In mid-May, when a "tail" of oil entered the northern part of the Loop Current, it created a potential pathway for oil to be transported to the Florida Keys, Cuba, or the Bahamas. With this change in the scale of the trajectory forecasts, OR&R began producing forecasts for two regions: nearshore and offshore. The offshore forecasts also supported daily response planning, predicting where surface oil impacted by the Loop Current system would be in the next 24, 48, and 72 hours. Weeks later, when recoverable oil was no longer observed in overflights or satellite analyses in this region, the offshore forecasts were phased out. These maps were produced from May 18 through June 17, 2010.
Loop Current Location Relative to Oil Slick: In mid-July, OR&R began producing maps to provide daily updates of the location of the Loop Current and its major eddies, and the location of floating oil relative to the Loop Current system. After more than a month of daily mapping, overflights and satellite analyses eventually showed no recoverable oil in this area, and the threat of oil being transported by the Loop Current diminished. These maps were produced from July 15 through August 23 (except August 14 and 15), 2010.
Understanding the Trajectory Maps
The following publications were created to help map users understand and interpret the oil trajectory maps.
- Field Guide to NOAA's Oil Trajectory Maps [PDF, 303 KB]: This short guide to the oil spill trajectory maps produced by OR&R outlines how a trajectory is predicted and the key parts of the maps.
- NOAA Trajectory Maps Presentation [PDF, 1.2 MB]: This presentation about the trajectory forecast maps produced during the Deepwater Horizon spill response describes how the forecasts were created, the types of forecasts produced each day, the information contained in the maps (e.g., the areas predicted to be oiled, the uncertainty boundary), and how to interpret the map information.
More Information about the Deepwater Horizon Oil Spill
Where to Find NOAA Information on the Deepwater Horizon Oil Spill: This page provides information and links to the most up-to-date information on NOAA activities related to the Deepwater Horizon oil spill.
Questions: Contact us with questions about our spill trajectory maps.