After Sandy, Adapting NOAA's Tools for a Changing Shoreline
SEPTEMBER 19, 2013 -- While the beach season has come to an end for the East Coast, communities of the northeast continue to repair remaining damage from last fall's Post Tropical Cyclone Sandy and prepare for future storms.
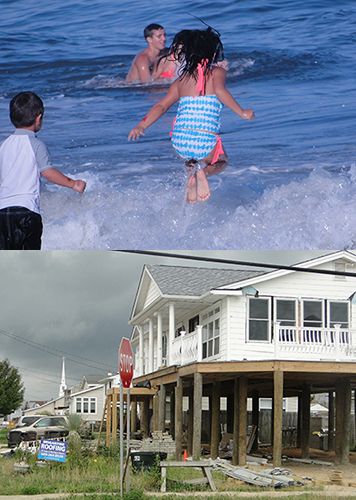
As beachgoers arrived at the shore this past summer, they found a lot of repaired structures and beautiful beaches. But this was side-by-side with reconstruction projects, damaged buildings, and altered shorelines.
In addition to damaging manmade structures, Sandy's strong winds and waves caused considerable change to shorelines, particularly in the metropolitan New York area, northern Long Island, Connecticut, and New Jersey.
Tools for Coastal Disasters
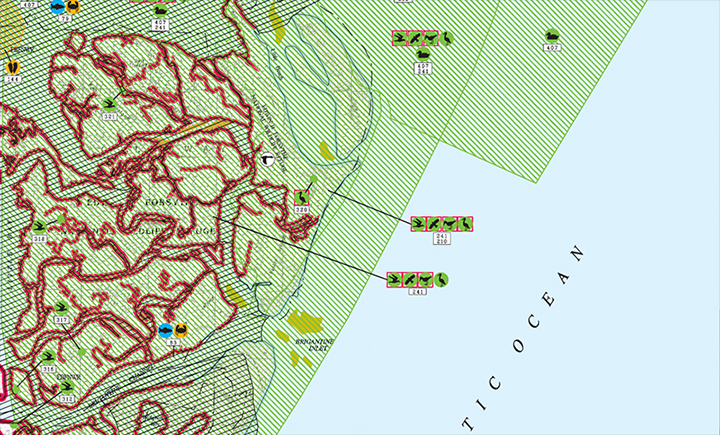
In the wake of Sandy, under the Disaster Relief Appropriations Act of 2013, funds were allocated to update the Office of Response and Restoration's existing northeast Environmental Sensitivity Index (ESI) maps to reflect changes caused by the storm and to add information that would enhance the maps' value when another disaster strikes. Historically used mostly for oil and chemical spills, these maps have also proved to be effective tools in preparing for and responding to storms and hurricanes.
ESI maps provide a concise summary of coastal resources that could be at risk in a disaster. Examples include biological resources (such as birds and shellfish beds), sensitive shorelines (such as marshes and tidal flats), and human-use resources (such as public beaches and parks). They are used by both disaster responders during a disaster and planners before a disaster.
In the region affected by Sandy, maps will be updated from Maine to South Carolina. The ESI maps are produced on a state or regional basis. They typically extend offshore to include all state waters, and go inland far enough to include coastal biology and human use resources.
In addition to the outer coastal regions, navigable rivers, bays, and estuaries are included. In the northeast, these include the Hudson River and Chesapeake Bay, which are among those maps being updated with the Sandy funding, as well as Delaware Bay, which was already in progress before the storm hit.
The first region to be updated will be Long Island Sound. NOAA's Office of Response and Restoration is partnering with the Center for Coastal Monitoring and Assessment (CCMA) in NOAA's National Centers for Coastal Ocean Science to develop the biological and human use information for this region. This partnership will take advantage of studies CCMA currently has underway, as well as contacts they have made with the biological experts in the area.

Keeping up with a Changing Shoreline

The coastal environment is constantly changing and ESI maps need to be updated periodically to reflect not just storm damage, but changes to resources caused by human use, erosion, and climate change. The new maps will be created with a broad range of potential disasters in mind.
To support this goal, some additional data elements and layers are being considered for the ESI maps developed as part of the post-Sandy effort. These may include such things as flood inundation and storm surge areas, environmental monitoring stations, tide stations, and offshore renewable energy sites.
The end products will provide emergency planners and responders with a better tool for protecting the northeast and mid-Atlantic shoreline when the next coastal disaster occurs.
You can learn more about our Environmental Sensitivity Index maps in our blog post "Mapping How Sensitive the Coasts Are to Oil Spills," and find more technical insights into our work with ESI maps and data in the ESI section of our website.
 An official website of the United States government.

