 An official website of the United States government.
 Mapping How Sensitive the Coasts Are to Oil Spills
")
JUNE 21, 2012 — The U.S. shoreline stretches 95,471 miles, from the coast of Alaska to the Great Lakes to the Gulf of Mexico. However, these shores vary greatly in type, in how people use them, and in which species of birds, fish, and wildlife inhabit them. These differences affect how sensitive the shorelines are to spilled oil and other environmental hazards.
NOAA works with the federal and state governments to produce Environmental Sensitivity Index (ESI) maps, which identify coastal locations that may be especially vulnerable to an oil spill. This series of maps shows the shorelines, wildlife, and habitat most sensitive to oil, as well as the resources people use there, such as a fishery or recreational beach.
For example, an ESI map in North Carolina might indicate an estuary where piping plovers, a threatened shorebird, nest between March and August. It would also display a color-coded ranking revealing that the saltwater marsh is highly sensitive to oiling and show the presence of and contact information for a nearby marina.

Quick Decisions
When a shoreline is threatened by an approaching oil spill, responders must decide quickly which locations along a shoreline to protect. Making these decisions sometimes requires difficult tradeoffs. Having this valuable information ready beforehand helps spill planners and responders prioritize areas to protect from oil and identify appropriate cleanup strategies.
For NOAA's Office of Response and Restoration, one of our main goals in oil spill response is to reduce the environmental consequences of both spills and cleanup efforts. We help create and maintain ESI maps to facilitate the decision-making process surrounding these efforts. Some of the human-use resources on ESI maps include potential access points and staging areas, including boat launches and airports, which would be useful during an oil spill response.
Digital Maps
We offer ESI maps—and the data represented on them—for all of the U.S. coastal states and territories. Besides traditional print maps, we also make the data available through geographic information system (GIS) technology, which allows a much greater level of detail. You can see what digital file formats are available and download maps for your geographic region.
While all of the digital ESI maps are available in a free format, our team also has developed a collection of tools to simplify viewing and querying the data in an advanced GIS format. One of our newer tools, the Seasonal Summary Tool, creates a personalized ESI map, giving a snapshot of everything going on in a specific region for a particular time of the year. This may be beneficial for responders looking at an area impacted by an oil spill.
Another feature of the digital maps and data is that they group together species with common habitats, behaviors, and feeding patterns. One ESI tool can take advantage of this grouping to allow users to view areas where only those groups, such as birds of prey, occur. The user can filter this information further to show only the areas where these birds may be nesting in June or show only federally threatened or endangered species.
A variety of people make use of Environmental Sensitivity Index maps, from the U.S. Coast Guard and Bureau of Ocean Energy Management (BOEM), to the Army Corps of Engineers and state contingency planners and emergency responders. ESI maps are a constantly evolving product for constantly changing coasts and are rich with complex information.
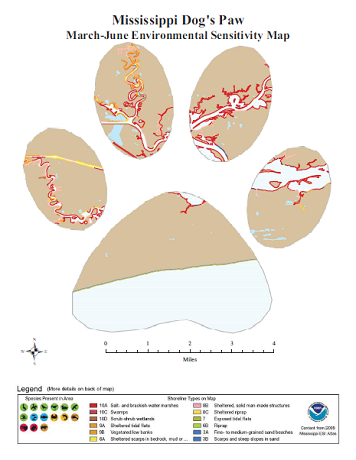
Since 1990, Jill Petersen has been observing this evolution firsthand, through her work on Environmental Sensitivity Index maps for the Office of Response and Restoration. While demonstrating some of the advanced GIS tools in 2011, Petersen highlighted one which also allows users to draw their own geographic boundaries. The boundaries she, a canine enthusiast, chose for the Mississippi map? A dog's paw, of course.