How Do We Use Satellite Data During Oil Spills?

FEBRUARY 19, 2016 -- Did you know satellites measure many properties of the Earth's oceans from space?
Remote sensing technology uses various types of sensors and cameras on satellites and aircraft to gather data about the natural world from a distance.
These sensors provide information about winds, ocean currents and tides, sea surface height, and a lot more.
NOAA's Office of Response and Restoration is taking advantage of all that data collection by collaborating with NOAA's Satellite and Information Service to put this environmental intelligence to work during disasters such as oil spills and hurricanes.
Remote sensing technology adds another tool to our toolbox as we assess and respond to the environmental impacts of these types of disasters.
In these cases, which tend to be larger or longer-term oil spills, NOAA Satellites analyzes earth and ocean data from a variety of sensors and provides us with data products such as images and maps.
We're then able to take that information from NOAA Satellites and apply it to purposes ranging from detecting oil slicks to determining how an oil spill might be impacting a species or shoreline.

Slick Technology
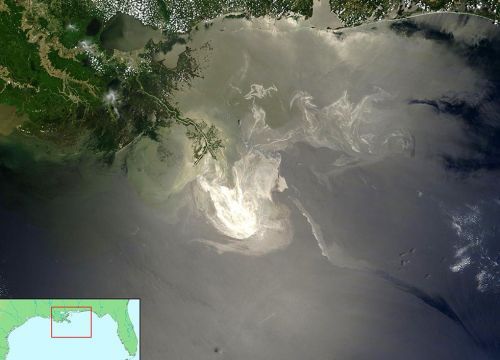
During an oil spill, observers trained to identify oil from the air go out in helicopters and planes to report an oil slick's exact location, shape, size, color, and orientation at a given time. Analogous to this "remote sensing" done by the human eye, satellite sensors can help us define the extent of an oil slick on the ocean surface and create a target area where our aerial observers should start looking for oil.
In the case of a large oil spill over a sizable area such as the Gulf of Mexico, this is very important because we can't afford the time to go out in helicopters and look everywhere or sometimes weather conditions may make it unsafe to do so.
Satellite remote sensing typically provides the aerial footprint or outline of the surface oil (the surface oiling extent). However, oil slicks are patchy and vary in the thickness of the oil, which means having the outline of the slick is useful, but we still need our observers to give us more detailed information. That said, we're starting to be able to use remote sensing to delineate not just the extent but also the thickest parts of the slicks.
Armed with information about where spilled oil may be thickest allows us to prioritize these areas for cleanup action. This "actionable oil" is in a condition that can be collected (via skimmers), dispersed, or burned as part of the cleanup process.
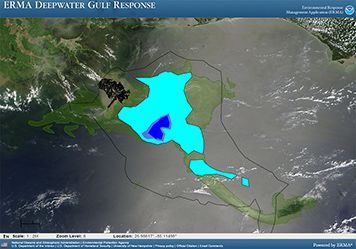
You can see how we mapped the surface oiling extent during the Deepwater Horizon spill based on data analyses from NOAA Satellites into our online response mapping program ERMA.
A Model for the Future
A common use of remotely sensed data in our work is with our oil spill models. Reports of a slick's extent from both satellite sensors and aerial observers, who report additional information about constantly changing oil slicks, helps our oceanographers improve the forecasts of where the oil will be tomorrow.
Just as weather forecasters continually incorporate real-time observations into their models to improve accuracy, our oceanographers update oil spill trajectory models with the latest overflights and observations of the surface oiling extent (the area where oil is at a given moment). These forecasts offer critical information that the Coast Guard uses to prioritize spill response and cleanup activities.
A Sense of Impact
Over the course of an oil spill, knowing the surface oiling extent and where that oil is going is important for identifying what natural resources are potentially in harm's way and should be protected during the spill response.
In addition, the data analyses from remote sensing technology directly support our ability to determine how natural resources, whether salt marshes or dolphins, are exposed to spilled oil. Both where an oil slick is and how often it is there will affect the degree of potential harm suffered by sensitive species and habitats over time.
In recent years, we've been learning how to better use the remote sensing data collected by satellite and aircraft to look at how, where, and for how long coastal and marine life and habitats are impacted by oil spills and then relate this oil exposure to actual harm to these resources.
Large amounts of oil that stay in the same place for a long time have the potential to cause a lot more harm. For example, dolphins in a certain impacted area might breathe fumes from oil and ingest oil from food and water for weeks or months at a time. Without remotely sensed data, it would be nearly impossible to accomplish this task of tying the exact location and timing of oil exposure to environmental harm
Remote Opportunities
The 2010 Deepwater Horizon oil spill provided us with a number of new opportunities to work with remotely sensed data. For example, we used this technology to examine the large scale features of the circulation patterns in the Gulf of Mexico, such as the fast-moving Loop Current and associated eddies. The Loop Current is a warm ocean current that flows northward between Cuba and Mexico's Yucatán Peninsula, moves north into the Gulf of Mexico, then loops east and south before exiting through the Florida Straits and ultimately joining the Gulf Stream.
During this oil spill, there were concerns that if the oil slick entered the Loop Current, it could be transported far beyond the Gulf to the Caribbean or up the U.S. East Coast (it did not). NOAA used information from satellite data to monitory closely the position of the slick with respect to the Loop Current throughout the Deepwater Horizon oil spill.
Our partnership with NOAA's Satellite and Information Service has been a fruitful one, which we expect to grow even more in the future as technology develops further. In January, the NOAA satellite program launched the Jason-3 satellite, which will continue to collect critical sea surface height data, adding to a satellite data record going back to 1992. One way these data will be used is in helping track the development of hurricanes, which in turn can cause oil spills. We hope ongoing collaboration across NOAA will further prepare us for the future and whatever it holds.
 An official website of the United States government.