From Paper to Pixels: Mapping Pollution Response in the Digital Age
MARCH 1, 2013 — The initial phase of responding to an oil spill or natural disaster can often be described as "organized chaos." Being able to manage effectively the resulting influx of data is crucial during that time.
Responders need to identify priority areas for cleanup, risks to the environment, and status of cleanup activities quickly and correctly. This enables both the response staff at the scene of the disaster and government leadership back at headquarters to make informed decisions about dealing with the event (whether it’s an oil spill, hurricane, etc.) and potential pollution.
Maps are one way to organize all these important data into a common picture that gives everyone the same "situational awareness" and tracks the progress of the pollution response over time. Traditionally, Geographic Information Systems (GIS) specialists at the incident command post (the nerve center of the pollution response) would painstakingly create and then either print or email these maps to responders and government leadership. However, over the past few years, NOAA's Office of Response and Restoration, which provides scientific and technical support for marine pollution, has become a leader in using web mapping to revolutionize how people respond to these environmental emergencies.
The Past: Paper Cuts
Jill Bodnar's specialty is using Geographic Information Systems (GIS) during pollution responses, and she has honed these skills in numerous drills and incidents over her past 12 years working at NOAA. Through the mid-2000s, NOAA's information management team of GIS specialists like Bodnar would come to a pollution response with CDs full of base data as a starting point for the affected area. These CDs contained nautical charts, Environmental Sensitivity Index data showing natural resources at risk from oiling, state agency Area Contingency Plans, roads and waterways, and occasionally even aerial imagery. All of this information was fed into the GIS program on our laptop computers at the command post.
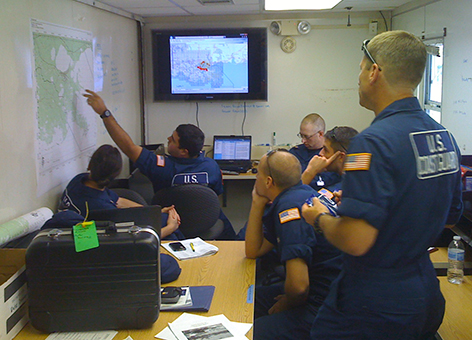
Next came the data pouring in from field observers working at the spill. This included the type and location of oil observed during overflight surveys, sightings of wildlife in the area, and strategies for placing oil containment boom. NOAA GIS specialists then would build maps reflecting this information and showing the status of cleanup operations. Responders waited as their paper maps were created and printed out before they briefed the leaders of the response (the Unified Command) or headed back into the field, maps in hand. The process was time-consuming, and the information management team often worked under very stressful conditions and late into the night. There was only enough time to get the basic information on to a map as soon as possible.
A big change in how maps were used at responses happened during Hurricane Katrina in 2005, which was around the time Google Earth and its satellite imagery became accessible to people without expensive desktop GIS programs. Suddenly, everyone at the command post wanted to print large, poster-sized maps layered over satellite imagery, which helped visualize the flooded carnage of New Orleans, surrounding neighborhoods, and coastal areas.
While the imagery provided unprecedented detail, printing it required a great deal of blue ink and plotter paper, which would quickly run out, hampering our efforts. Luckily Bodnar had a contact at Hewlett-Packard who sent them boxes and boxes of extra plotter paper and ink, and FedEx was able to deliver it to them despite their own issues with the hurricane. It was like Christmas (except with more paper cuts)!
But an even bigger change was in store when the Office of Response and Restoration (OR&R) unveiled the jump to modern-day web mapping for pollution response: the Environmental Response Management Application (ERMA®).
The Present and Future: Pixels
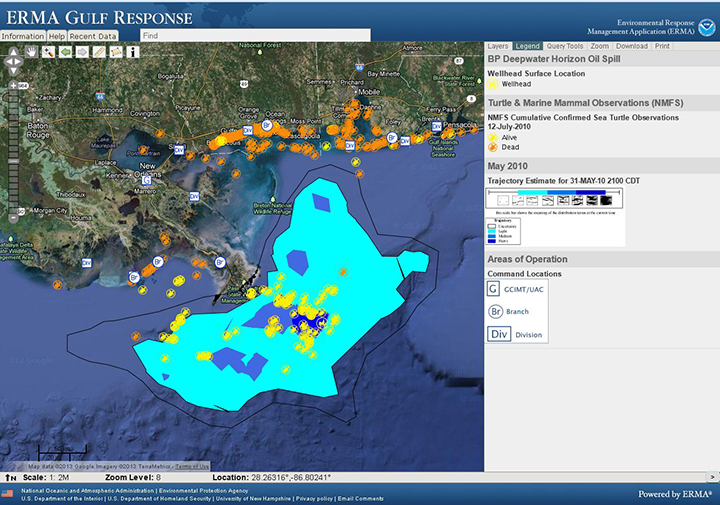
ERMA is an online mapping tool that integrates and synthesizes data—often in real time—into a single interactive map, providing a quick visualization of the situation after a disaster and improving communication and coordination among responders and environmental stakeholders. Developed by OR&R, U.S. Environmental Protection Agency, and University of New Hampshire, ERMA originally was released as a regional pilot project in New Hampshire in 2007. It has since expanded across the continental U.S., Caribbean, Arctic, and Pacific Islands.

But ERMA's most pivotal role has been in response to the Deepwater Horizon/BP oil spill in 2010. Federal, state, and local spill responders used ERMA to convey what was happening at the front lines of this massive spill: what shoreline had been oiled and how badly, satellite approximations of the spill's extent, fishery closures, and stranded marine life. At the height of the response, there were six different command posts around the Gulf of Mexico and in Washington, DC. NOAA had GIS specialists in each of them, uploading data 24/7 so that ERMA could be used in briefings to the Unified Command, the White House, NOAA leadership, and to the public via the ERMA Gulf Response website (a public-access version of ERMA). Once released to the public, ERMA was highlighted and used by media outlets to show, for example, current fishing closure areas.

In addition, ERMA allowed hundreds of responders and thousands of public users to see the information they needed—coming from multiple sources—at any time, heralding a new era in response where access to data and maps wasn't limited to a GIS specialist's printing capabilities.
Nearly three years later, the NOAA GIS team and other responders around the country are still working on the Deepwater Horizon/BP spill, which includes documenting resulting environmental injuries, and ERMA is a key technology helping them do that job.
More recently, ERMA was put into action during the Hurricane Sandy pollution response in the fall of 2012. During that response, ERMA was used successfully to show federal and state responders and NOAA and Coast Guard leadership post-hurricane satellite imagery, dozens of priority pollution locations, and on-the-ground field photos of impacted areas. Throughout this high-visibility event, ERMA put the most important data they needed to see in their hands.
To some extent, paper maps will always have their place at a response, especially since there is often no Internet connection, say, on a boat in the Gulf of Mexico. GIS specialists will always manage data and create maps to tell a story, but more than ever, ERMA is placing data at the fingertips of responders, often reducing the number of paper maps printed.
The emerging technologies behind ERMA and the power of the Internet are transforming how NOAA collects and manages information and how that translates to making decisions during an oil spill or hurricane response—resulting in more efficient and effective use of time, resources, and money. Not to mention saving Bodnar's fingers from future paper cuts.
 An official website of the United States government.
