Redrawing the Coast After Sandy: First Round of Updated Environmental Sensitivity Data Released for Atlantic States
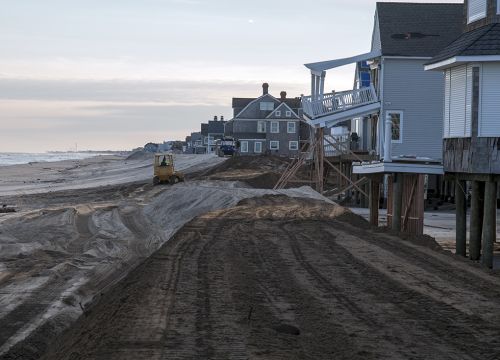
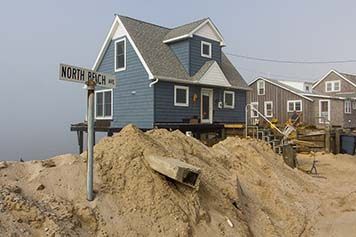
FEBRUARY 25, 2016 -- In 2012 Hurricane Sandy brought devastating winds and flooding to the Atlantic coast. In some parts of New Jersey, flood waters reached nearly 9 feet. Up and down the East Coast, this massive storm actually reshaped the shoreline. As a result, we've been working to update our Environmental Sensitivity Index (ESI) maps to reflect the new state of Atlantic shorelines. These maps and data give oil spill planners and responders a quick snapshot of a shoreline's vulnerability to spilled oil. This week, we released the digital data, for use within a Geographic Information System (GIS), for the first regions updated after Hurricane Sandy. Passed the January following Sandy, the Disaster Relief Appropriations Act of 2013 provided funds to update ESI maps for eleven Atlantic coast states, ranging from Maine to South Carolina. For this project, we grouped the states into seven regions. The GIS data for the regions released this week cover South Carolina and portions of New York and New Jersey, including the Hudson River, south Long Island, and the New York–New Jersey metropolitan area. For these two regions, we mapped more than 300 oil-sensitive species and classified over 17,000 miles of shoreline according to their sensitivity to spilled oil. Updated GIS data and PDF maps for the remaining regions affected by Sandy will be available in the coming months.
Time for a Change
The magnitude of the overall effort has been unprecedented, and provided us with the opportunity to revisit what was mapped and how, and to update the technology used, particularly as it relates to the map production. Our first Environmental Sensitivity Index maps were produced in the early 1980s and, since that time, the entire U.S. coast has been mapped at least once. To be most useful, these data should be updated every 5–7 years to reflect changes in shoreline and species distributions that may occur due to a variety of things, including human intervention, climate change, or, as in this case, major coastal storms. In addition to ranking the sensitivity of different shorelines (including wetlands and tidal flats), these data and maps also show the locations of oil-sensitive animals, plants, and habitats, along with various human features that could either be impacted by oil, such as a marina, or be useful in a spill response scenario, such as access points along a beach.
New Shores, New Features
To gather suggestions for improving our ESI maps and data, we sent out user surveys, conducted interviews, and pored over historical documentation. We evaluated all suggestions while keeping the primary users—spill planners and responders—at the forefront. In the end, several major changes were adopted, and these improvements will be included in all future ESI maps and data. Extended coverage was one of the most requested enhancements. Previous data coverage was focused primarily on the shoreline and nearshore—perhaps 2–3 miles offshore and generally less than 1 mile inland. The post-Sandy maps and data extend 12 nautical miles offshore and 5 miles inland. This extension enables us to include data such as deep water species and migratory routes, as well as species occurring in wetlands and human-focused features found further inland. With these extra features, we were able to incorporate additional hazards to the coastal environment. One example was the addition of storm surge inundation data, provided by NOAA’s National Hurricane Center, which provide flood levels for storms classified from Category 1 to Category 5. We also added more jurisdictional boundaries, EPA Risk Management Facilities (the EPA-regulated facilities that pose the most significant risk to life or human health), repeated measurement sites (water quality, tide gauges, Mussel Watch sites, etc.), historic wrecks, and locations of coastal invasive species. These supplement the already comprehensive human-use features that were traditionally mapped, such as access points, fishing areas, historical sites, and managed areas. The biological data in our maps continue to represent where species occur, along with supporting information such as concentration, seasonal variability, life stage and breeding information, and the data source. During an oil spill, knowing the data source (e.g., the U.S. Fish and Wildlife Service) is especially important so that responders can reach out for any new information that could impact their approach to the spill response. A new feature added to the biological data tables alerts users as to why a particular species’ occurrence may warrant more attention than another, providing context such as whether the animals are roosting or migrating. As always, we make note of state and federal threatened, endangered, or listed species.
Next up
Stay tuned for the digital data and PDF maps for additional Sandy-affected regions. While the updated PDF maps will have a slightly different look and feel than prior ones, the symbology and map links will be very familiar to long-time users. In the meantime, we had already been working on updating ESI maps for two regions outside those funded by the Disaster Relief Appropriations Act. These regions, the outer coast of Washington and Oregon and the state of Georgia, have benefited from the general improvements brought about by this process. As of this week, you can now access the latest GIS data for these regions as well.
 An official website of the United States government.

