Why You Should Thank a Hydrographer
JUNE 21, 2013 -- World Hydrography Day is celebrated each year on June 21. But before we start thanking hydrographers, we first should explain: What is a hydrographer? Basically, a hydrographer measures and documents the shape and features of the ocean floor and coasts. These scientists then create charts showing the ocean’s varying depths and the location of underwater obstructions, such as rocky outcroppings or shipwrecks. As our fellow NOAA colleagues at the Office of Coast Survey (an office full of hydrographers) further elaborate, "hydrographic surveying 'looks' into the ocean to see what the sea floor looks like," with most of the work "primarily concerned with water depth." Mariners, unlike drivers on a dangerous road, can’t see the whole picture of the path their ships are taking. Is this harbor deep enough for a large ship to enter safely? Where should they avoid sensitive coral reefs? They rely on NOAA's nautical charts to show them what is on the sea floor and where there are objects or areas to avoid. Sometimes, however, ships do run afoul with underwater features—which, for example, could be coral reefs, pipelines, or damaged oil service platforms—leading to oil spills or crushed coral reef habitats. That brings our office into the picture to help minimize the environmental damage and then work to restore it. This is why we at the Office of Response and Restoration are grateful for the hydrographers who are diligently creating and updating the charts that keep our ocean and its travelers safe. Beyond that, here are a few more reasons why we (and hopefully you) would want to thank a hydrographer.
Modeling Leaking Shipwrecks
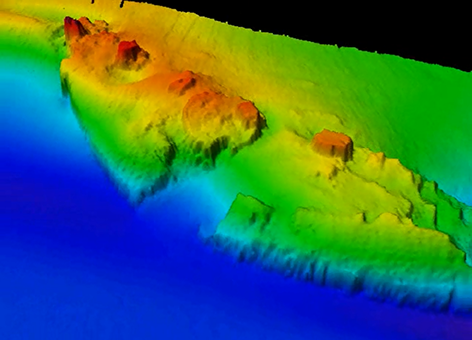
Remote sensing data from hydrographic surveys are, in many instances, the first picture we have of a shipwreck and give us some sense of what state the ship is in before NOAA sends down divers or remotely operated vehicles (ROV). We know that even ships broken into two or three sections can still hold a significant amount of oil (from fuel or cargo). Recently, we worked with NOAA’s Office of National Marine Sanctuaries to evaluate the thousands of shipwrecks in U.S. waters for those with the potential to leak oil still onboard. In a report to the U.S. Coast Guard, we highlighted 17 wrecks, in particular, that should be assessed further and possibly have any remaining oil removed. Coast Survey recently finished surveying one of these wrecks, the freighter Fernstream [PDF], which sank after colliding with another ship near San Francisco Bay in 1952. One of their physical science technicians then created a vibrant three-dimensional model of the wreck, with the colors representing different water depths detected by multibeam sonar. From this kind of information, maritime archaeologists can interpret how the wrecked ship might be oriented on the sea floor and estimate where oil tanks could be located.
Mapping Environmental Responses
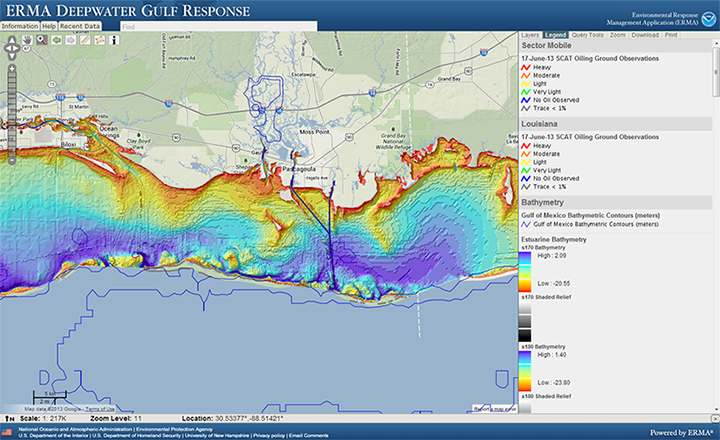
Bathymetry, or water depth measurement, data is one of the primary data sets we use as a base layer in ERMA®, our online mapping tool for environmental planning and response. We often display high resolution bathymetry data in ERMA to better understand areas of interest, such as the site of a ship spilling oil. ERMA can readily pull in bathymetry data feeds from NOAA and university partners to help our scientist refine models of the water column and classify aquatic habitat. High resolution bathymetry data was particularly useful for visualizing the area surrounding the damaged wellhead for the Deepwater Horizon wreckage and has aided in assessing risk to nearshore habitats on the Gulf Coast.

During the response to an oil spill or ship grounding, we sometimes work with hydrographers who may be able to do new underwater surveys of the affected area. In addition, with access to huge databases of bathymetry data, they can offer much more detailed information than what is on the average nautical chart, helping us guide response decisions, such as where response vessels can be anchored safely. For example, when Shell’s Arctic drilling rig Kulluk ran aground off Kodiak Island, Alaska, on Dec. 31, 2012, a Coast Survey specialist, using detailed nautical charts and data, helped us identify nearby Kiliuda Bay as a suitable safe harbor to relocate the rig.
Detecting Submerged Hurricane Debris
After a hurricane, lots of debris from on land, including oil drums, shipping containers, and chemical tanks, can get swept into the ocean. This has been a notable issue following Hurricane Sandy in the fall of 2012. Currently, Coast Survey is collecting hydrographic data to update their charts from North Carolina to Connecticut, the states affected by Hurricane Sandy. We will be focusing in particular on the data they gather for New Jersey, New York, and Connecticut and whether they find items on the sea floor larger than one cubic meter in size (about 35 cubic feet). That survey data then will be processed by the University of New Hampshire's Joint Hydrographic Center. Their analyses will inform our Marine Debris Program's future efforts to prioritize and remove the submerged debris items detected in these surveys.

 An official website of the United States government.