 An official website of the United States government.
 Announcing ESI Data Online!
UPDATED AUGUST 31, 2016 -- Several ESI online viewing systems have been discontinued due to reorganization of the offices that support them. We are working to build similar functionality into our online mapping tool, ERMA®; however, it will take some time to complete that work. As an alternative to online viewing of ESI data, you can download the data from our ESI Downloads page. As our ESI data are updated, they will be published there. Please let us know if you have questions.
APRIL 19, 2013 -- Thanks to NOAA’s Special Projects office (SPO), in particular Nipa Parikh, Robb Wright, and Robby Wilson, NOAA’s online ESI Data Viewer is ready to launch. For the past several months, this group has coordinated with the ESI team to provide a user-friendly, online interface, enabling viewing and simple querying of the ESI GIS data layers, as well as viewing and download of individual ESI PDF maps. The area covered includes all but three of the ESI atlases (which will be added soon), representing the majority of the contiguous U.S. coastline, Alaska, Hawaii, and the U.S. territories. It’s been a BIG job, and we’re excited to roll it out! The project is comprised of three distinct services: the ESI Data Viewer; an online viewing option for the Threatened and Endangered Species databases; and the National ESI Shoreline. We encourage you to test the features of these services (currently in beta version) and provide your feedback.
ESI Data Viewer
The new Environmental Sensitivity Index Data Viewer allows you to pick your region of interest, divided up by ESI atlas boundaries, and turn on individual ESI layers to query.
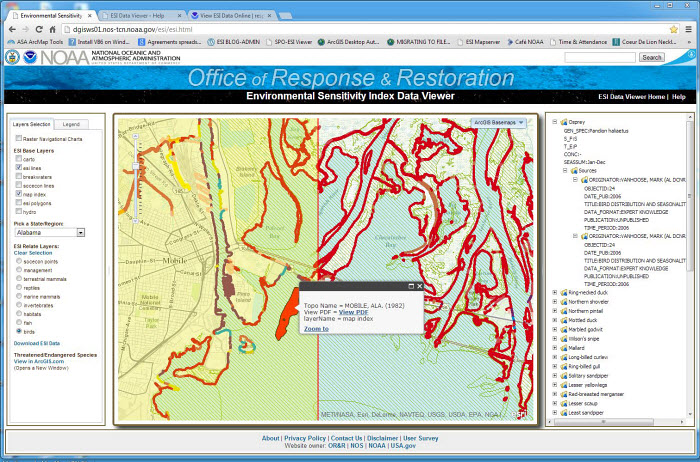
In the screenshot of the Mobile, Alabama area, seen above, the following layers are turned on: birds, ESI lines, and the map index. These layers are displayed on top of the ArcGIS Topographic basemap; you can select from a variety of ArcGIS Basemaps using the drop-down list in the upper right corner of the map. The NOAA Raster Navigational Charts and, in some areas, the tiled ESI PDF maps are also options for backdrops. The Navigational Charts can be selected at the top of the Layers Selection panel, located to the left of the map. The ESI Seamless PDFs, if available, can be selected below that, in the ESI Base Layers section. In this example, a bird polygon has been selected, as well as the index map polygon in which it lies. The selected bird polygon is shown as a solid red map object; the selected index polygon has a transparent yellow hue, and is outlined in red. A pop-up window provides some information about the index polygon, and includes a link to the corresponding ESI PDF. The bird species found within the selected polygon are listed in the right panel. In this list, clicking the plus sign next to one of the species’ common names will provide additional information about that species, particular to the polygon selected. Above, you see the details for the Osprey. Its genus/species is Pandion haliaetus, it is State protected (the State/Federal designation, S_F, is “S” for state; the Threatened/Endangered designation, T_E, is “P” for protected*), and it is present in the area year round (Jan-Dec). Clicking the plus sign next to Sources, you learn that the source of the data was Mark Vanhoose at Alabama Department of Conservation and Natural Resources (AL DCNR). Any attributes associated with the ESI Base Layers listed in the top section of the left panel, will be shown using the pop-up window. The attributes of layers listed under the header, ESI Relate Layers, will be shown in the right panel, as in the above example for the bird layer. Only one of the Relate Layers can be shown at any given time.
Threatened and Endangered Species databases
The second product developed in this effort is an online viewing option for the Threatened and Endangered Species databases. (A recent blog post provides more information about these databases.)
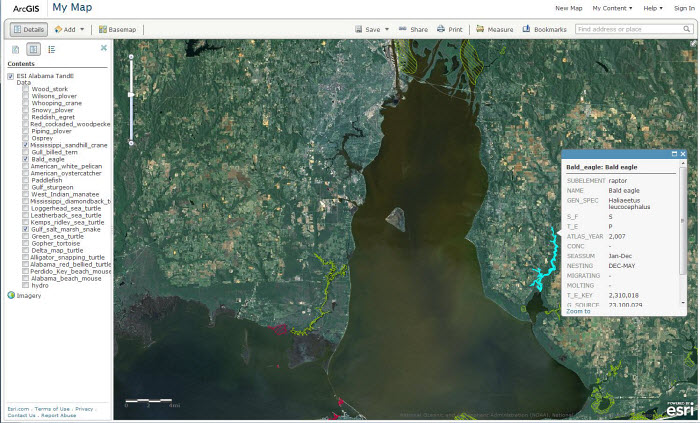
The screenshot above shows the location of several threatened/endangered species in Alabama: the Mississippi sandhill crane, the Bald eagle, and the Gulf salt marsh snake. In this example, the ArcGIS imagery basemap is used but, as in the ESI Data Viewer, you can select the ArcGIS basemap of your choice. If pop-up windows are enabled for the layer, clicking on a species polygon will show a window with details of the species in that area. In this case, the selected Bald eagle polygon, highlighted in blue, represents an area where the eagle is present year round (Jan-Dec) and is nesting December through May. You can also see that this species was listed as State protected (S_F shows “S” for state; T_E shows “P” for protected) in 2007, the year the atlas was published. It’s important to remember that protection status is not static, and that the ESI data are a snapshot in time. The status shown reflects the listing status at the time of the atlas publication.
National ESI Shoreline
Our third new online product is the National ESI Shoreline. The shorelines from approximately 45 ESI atlases were merged to create this seamless, attributed shoreline. The shoreline has four display options:
- National ESI Shoreline is a simple black line presentation of the ESI shoreline, showing the land/water interface.
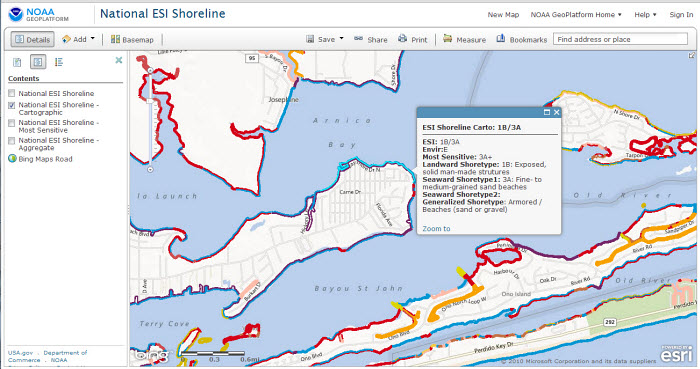
- National ESI Shoreline – Cartographic displays a shoreline symbolized by ESI value. In cases where there are multiple ESI types occuring within a shoreline segment, multi-colored lines are used to represent each ESI type present. For example, for a shoreline segment with the ESI value of 1B/3A, the landward shoreline color will be purple, representing type 1B (exposed, solid man-made structures), and the seaward color will be blue, representing type 3A (fine- to medium-grained sand beaches).
- National ESI Shoreline – Most Sensitive is a shoreline symbolized by a single colored line, based on the most sensitive ESI type present. Since increased sensitivity to oiling is indicated by higher numeric values in the ESI field, a shoreline with an attribute of 1B/3A/9A would have a “most sensitive” value of 9A (sheltered tidal flats), and be shown on the map as an orange line.
- National ESI Shoreline – Aggregate is a shoreline symbolized using a simplified shoreline classification scheme. Values range from 1 to 5. As an example, ESI types 1A (Exposed rocky shores), 2A (Exposed, wave-cut platforms in bedrock, mud or clay), 3C (Tundra cliffs), and 8A (Sheltered rocky shores), among other types, are all condensed to a more general category, 1 – “Armored,” and symbolized by a purple line. The other general shoreline types are: 2 – “Rocky and steep shorelines (rock, sand or clay),” 3 – “Beaches (sand or gravel),” 4 – “Flats (mud or sand),” and 5 – “Vegetated (grass/marsh/mangroves/scrub-shrub).” All ESI values have been mapped to the appropriate “general” field for this presentation. The symbolization is based on the highest numeric general ESI type present in the segment.
If pop-up windows are enabled, you can select a shoreline segment to see the ESI rank and description, as well as the generalized classification and description. Below you can see an example of the cartographic presentation along with the shoreline pop-up box.
All of the data used in the online data products are also available as a map service. This means you can bring the data into your own ArcMap session and offers an alternative to downloading the dataset to your computer. This is particularly useful if you want a quick look at the data in reference to other items on your map. For more in-depth viewing and analysis, it may still be appropriate to download the ESI data from the ESI downloads page, where you can get the geodatabase and a supporting map document for the atlas of your choice.
So, take the new products for a spin! Be sure to let us know of any problems you experience, or any suggestions or ideas for future development! And thank you again to Nipa, Robb and Robby. It has been a pleasure working with all of you!
*For an explanation of the feature layer names and the attribute headers and values, click the Help link in the upper right corner of the Data Viewer window. The online help section also provides an overview of the ESI Data Viewer features and some information about how to navigate within the program. [Back to text]