College of Charleston Students Create Interactive GIS Story Maps with Regional Marine Debris Data
DECEMBER 23, 2019 — On November 13, Sarah Latshaw, Southeast Regional Coordinator for NOAA’s Marine Debris Program, visited a College of Charleston Introduction to Geographical Information Systems (GIS) class to talk about the issue and share marine debris data.

She presented the students with several marine debris datasets, and discussed what information the Marine Debris Program would like to learn from each. As part of their end of semester project, the students worked in groups to clean up, organize, map, model, and analyze the data. Sarah attended the final presentations on December 9, where students outlined their work and provided NOAA with a better understanding of the data.
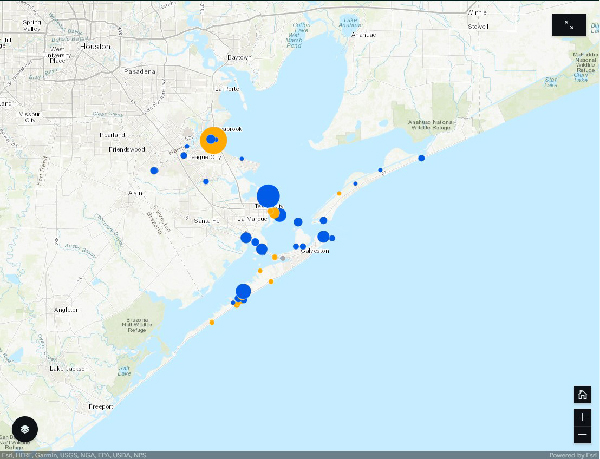
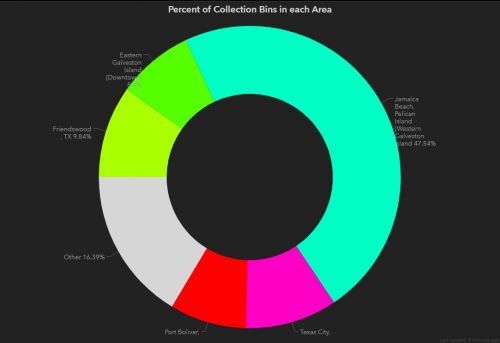
For example, the Galveston Bay Area Master Naturalists build monofilament fishing line recycling bins, map their locations, and log weight removed from each bin. The group wanted to know which bins were getting the most use, what areas need more or fewer bins, and if there was a difference in using 4’’ vs. 6’’ PVC when building the bins. The students presented their findings in a story map, and were able to highlight areas around Galveston Bay where current bins weren’t being used and areas with very high usage that could benefit from extra bins. Additionally, through the students’ analysis, they determined there was no difference in the use of 4’’ vs. 6’’ bins, information which could save the Master Naturalist group money each year.
Emma Paz is the GIS Adjunct Professor who teaches this course. As a former College of Charleston GIS student and now a GIS Developer for the City of Charleston, Emma realizes the need to provide real-world examples of how her students’ work can benefit others. Emma explains, “What’s great about their projects is that the students get to meet people from different organizations and agencies, hear about their needs, and in turn provide maps, analysis, and much more. It’s a win win for the students and practitioners who shared their data needs.”
For more information, please contact Sarah.Latshaw@noaa.gov.

