Environmental Sensitivity Index Maps and Data Now Available for ArcGIS Online
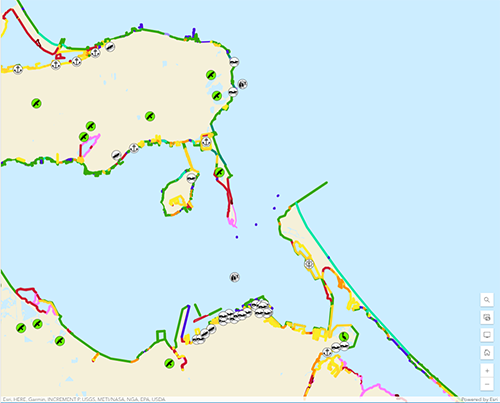
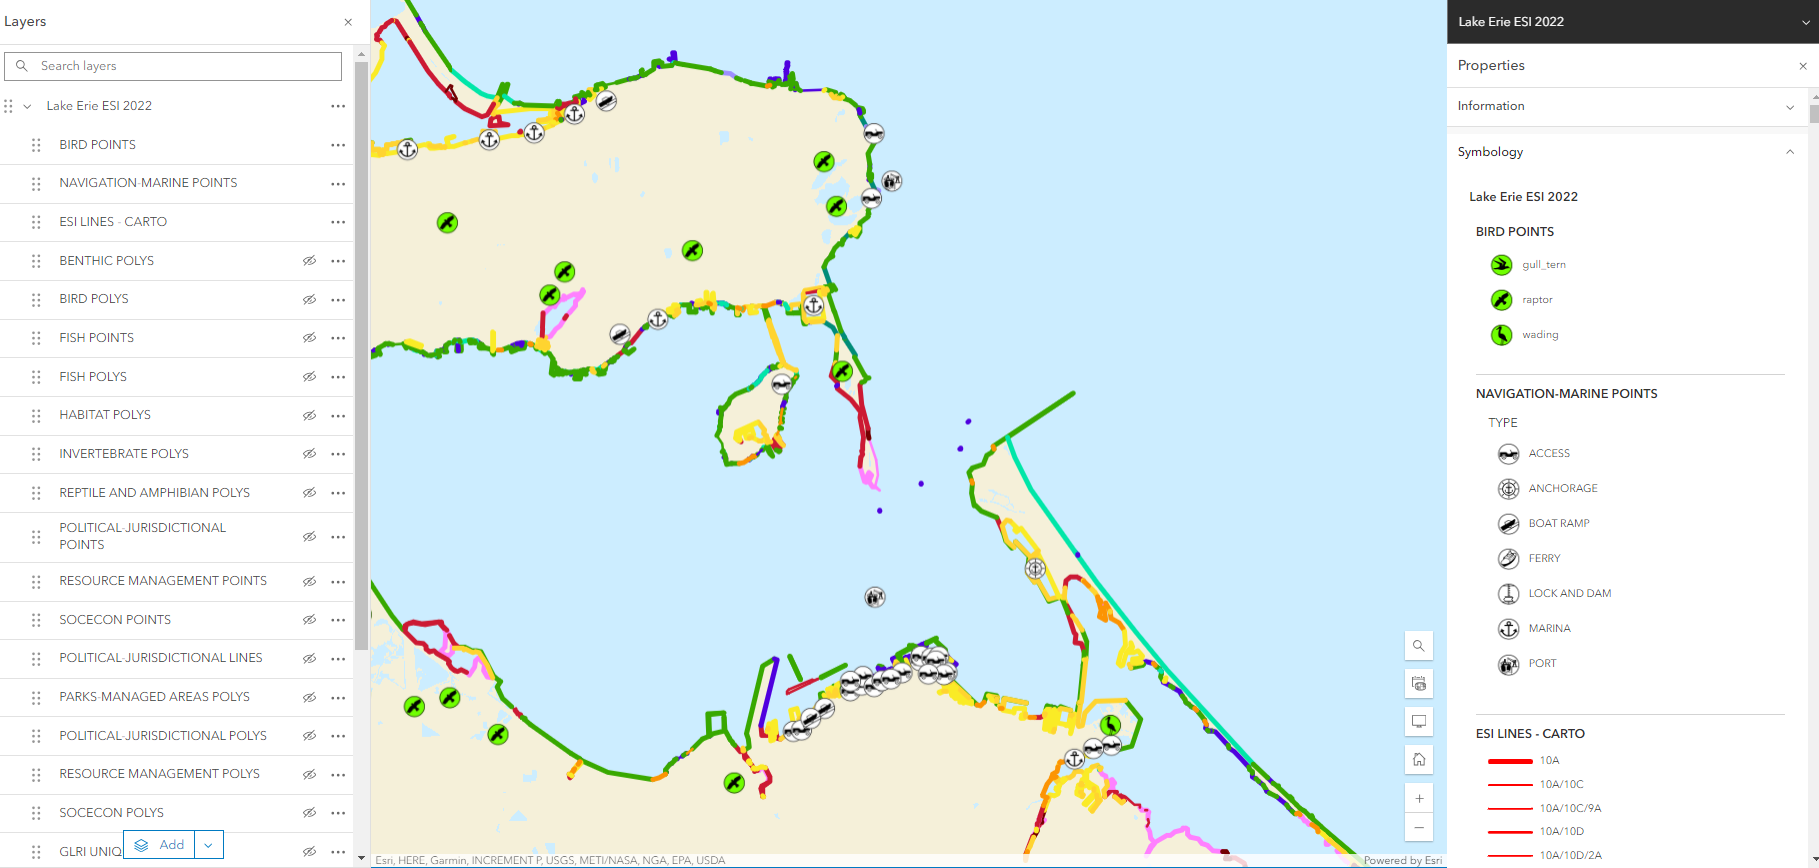
APRIL 8, 2024 — One of the key tools used in oil spill response, Environmental Sensitivity Index (ESI) maps and data, is now available on NOAA GeoPlatform, a cloud GIS application based on Esri’s ArcGIS Online. NOAA GeoPlatform provides access to a wide suite of trusted geospatial data, services, and applications that help support NOAA's mission.

OR&R develops and maintains ESI maps and data for use in oil and chemical spill planning and response. They provide a summary of coastal resources at risk during spills—including biological species, shorelines, and resources for human use. Each atlas covers a specific region of the U.S. coast, including the Great Lakes. Members of OR&R’s Spatial Data Branch ported over 40 atlases and over 20 datasets of Threatened & Endangered (T&E) Species to GeoPlatform, covering all parts of the U.S. shoreline.
ESI data is readily available on the OR&R website, through downloadable PDF files and GIS data files, and through NOAA’s Environmental Response Management Application (ERMA®). This new option on NOAA GeoPlatform will enable oil spill responders, planners, and the public to add the data directly to Esri’s ArcGIS software or their own maps and applications on ArcGIS Online.
OR&R will continue to maintain and update ESI maps on NOAA Geoplatform as individual atlases are refreshed over time.
Full ESI atlases are available on NOAA GeoPlatform.
T&E Species versions for select atlases are also available on NOAA GeoPlatform.
more images


