 An official website of the United States government.
 Map of the Month: NOAA Environmental Sensitivity Index Maps
The Environmental Response Management Application (ERMA®) is NOAA’s online mapping tool that integrates both static and real-time data, enabling users to quickly and securely access, analyze, and display spatial data. The "Map of the Month" series highlights unique maps from throughout ERMA's use and history.
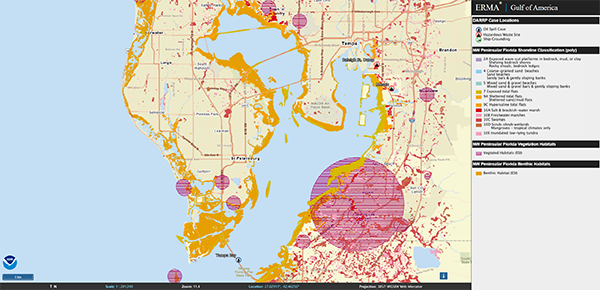
Shown in this map are the locations of NOAA’s Damage Assessment, Remediation, and Restoration Program Cases in Tampa Bay along with ESI shoreline, vegetation habitat, and benthic habitat.
ESI data contains a wealth of information that can be leveraged for planning, response, and restoration activities. The outcomes from the virtual workshop will make NOAA ESI data valuable for years to come by streamlining the data collection process as well as focusing on what is important to Natural Resource Advisors.
Visit the Gulf of America ERMA to explore the ESI maps and case locations.