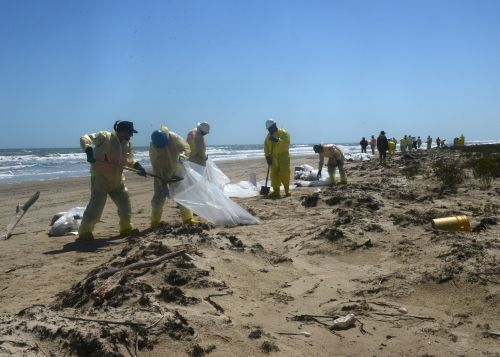
Story Map: Examining the Oil Pollution Act’s Legacy Through 30 Oil Spills
Thirty years ago today, in the wake of the Exxon Valdez disaster, the Oil Pollution Act of 1990 (OPA90) was passed unanimously by congress. This act streamlined and strengthened the U.S. government's ability to prevent, respond to, and hold polluters accountable for catastrophic oil spills.
This ArcGIS story map explores just one spill from each of the 30 years since OPA was passed. While these 30 spills represent a small fraction of overall events, we hope to shine a light on the real places and people who have been impacted by pollution and benefited from the Oil Pollution Act.
NOAA's Office of Response and Restoration provides scientific support, injury assessment, and restoration for oil spills. We provide scientific support for hundreds of spills each year, over 2,740 since the passage of the Oil Pollution Act, and with partners have recovered over $9.8 billion for restoration.
Over the past 30 years, NOAA continues to learn and evolve under the act's framework, developing state of the art tools and setting international standards for oil spill response, assessment, and restoration.
The legacy of the Oil Pollution Act is that it remains as important in 2020 as it was in 1990.
 An official website of the United States government.
