Getting the Download During a Disaster: Mapping the Hurricane Sandy Pollution Response
DEC. 17, 2012 — During a disaster, being able to keep track of the information flowing in about damages and operations can make a huge difference. Here, we give you some from-the-ground perspectives about how essential this can be during a response like the one to Hurricane Sandy.
NOAA Scientific Support Coordinator Ed Levine: The last weekend of October became very hectic for those of us in disaster response as Hurricane Sandy moved its havoc up the U.S. eastern seaboard. After the storm passed, initial reports indicated that coastal New York and New Jersey, especially around Long Island Sound and New York Harbor, were among the hardest hit.
When I arrived at the U.S. Coast Guard's base of operations on Staten Island, N.Y., I was surprised to find that the building was on generator power and back-up lighting; was without heat or telephones; and had minimal computer access and cell phone connectivity. In other words, they were part of the disaster.
Fairly quickly, however, they managed to set up an incident command post. Soon I was able to survey the coastal damage and pollution threats in a Coast Guard helicopter.
Many areas were extremely impacted. There were oils spills in a national park, within the harbor, along the coast, and in the Arthur Kill waterway bordering Staten Island. Shipping containers had been washed off piers and docks into the water and others were strewn about on land, not far from the piles of smaller boats run aground.
Having previously responded to several hurricanes in the Gulf of Mexico, I realized how quickly data management would become a major issue for tracking the pollution response as it progressed. The Coast Guard and other responders need accurate, up-to-date information and maps to coordinate their planning, inform their decisions, and execute their operations. That's where our team of information management specialists enter the picture.
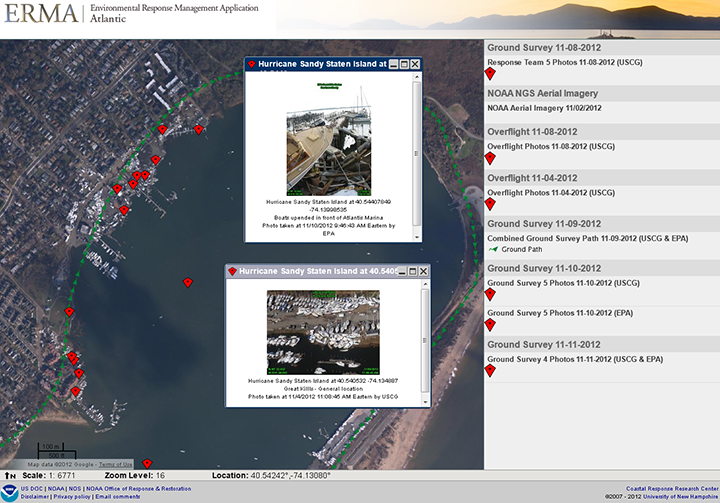
In a city still plagued by power outages, supply shortages, and long lines for gasoline, our Geographic Information Systems (GIS) specialists arrived to a hectic scene at the response command post. They began processing data coming in from field reconnaissance and feeding it into NOAA's Environmental Response Management Application (ERMA®) for the Atlantic Coast. ERMA is an online mapping tool that integrates and synthesizes data—often in real time—into a single interactive map, providing a quick visualization of the situation after a disaster and improving communication and coordination among responders and environmental stakeholders.
Welcome organizers of chaos, the team mapped high-priority locations of pollution and debris, displayed aerial imagery and on-the-ground photography, helped coordinate field team deployment, and identified areas of concern for environmental sensitivity and cultural and historical significance.
NOAA Geographic Information Specialist Jill Bodnar and her team: During the Hurricane Sandy pollution response, my colleagues and I divided the GIS work into two areas: general information management and ERMA support.
Information management is important because it becomes a source of accountability and for providing updates on the progress of cleanup operations and impacts to the surrounding natural resources. Well-run information management is crucial in identifying the priorities and status of pollution events quickly and correctly, which, for example, can help keep a leaking chemical drum from reaching a nearby estuary full of nesting birds.
At the Staten Island command post, Coast Guard field teams would arrive from a day of work and hand their cameras, GPS units, and often their field notes to our information management specialists. Then, we would upload photos, GPS coordinates, and field observations into software programs and spreadsheets, and the work of verifying the data would begin: Did we have all the data pieces we needed? Was it all correct?
Then, the information would get pulled into our central, web-based GIS application, ERMA. There are a few main roles for ERMA at a command post like the one on Staten Island. One of the foremost functions is to help Coast Guard operations field staff members visualize their field data, such as the pollution targets and field photos, and overlay them with post-hurricane satellite imagery onto a map.

NOAA Geographic Information Specialist Matt Dorsey: Field photos are very informative and give a lot of insight to some of the unique and complex issues for pollution prevention and removal following a hurricane or other emergency situations. Some of the less frequent but more challenging scenarios include vessels inside houses, vessels aground a mile away from the closest waterway, and many vessels swept out of marinas into sensitive marsh areas.
Vessels that had been swept into marshes were a big issue while I was there. The Coast Guard wanted to know which sensitive marsh areas had vessels washed into them, how to prioritize these boats for removing oil or gas aboard them, and how to put together a plan for removing the actual vessel without disturbing the area too much more than it already had been.
Jill Bodnar and her team: Using ERMA as the "big picture" of the response helps responders tell the story of a pollution site, such as a grounded fishing boat with a leaking fuel tank. The Coast Guard operations staff was using ERMA to identify these priority locations before they went in the field, and created their own customized maps to take with them. ERMA gave them a lot of freedom in planning their field activities because they did not have to rely solely on a GIS specialist to create and print maps for them.
ERMA also plays other roles for the Unified Command, which uses it to see the most current field data to plan for the next day's activities, to brief Coast Guard leadership on the scale and status of their teams' cleanup operations.
The benefit of everyone using a tool like ERMA is that everyone involved in the response—the Coast Guard, NOAA, Environmental Protection Agency, States of New York and New Jersey, and other agencies—is looking at the most up-to-date data, instead of information that may be a few days old. All of the responders and decision makers, both inside and outside of the incident command post, know they are looking at the same, consistent, high-quality information and using that to prioritize response decisions. Everyone sees the same picture—whether it's the frenzied first day after a disaster or weeks later.
Ed Levine works as Scientific Support Coordinator for NOAA's Office of Response and Restoration, where he provides scientific and technical support during oil and chemical spills in the New York area.
Jill Bodnar graduated from the University of Rhode Island with a Masters degree in natural resources, specializing in using GIS for oil spill response. She has been a geographic information specialist with NOAA's Office of Response and Restoration for over 11 years and has responded to numerous incidents in that time, including Hurricanes Katrina, Ike, Isaac, and Sandy, and the 2007 Cosco Busan and 2010 Deepwater Horizon/BP oil spills.
 An official website of the United States government.

