 An official website of the United States government.
 NOAA Builds Tool to Hold Unprecedented Amounts of Data from Studying an Unprecedented Oil Spill
")
The Deepwater Horizon Oil Spill: Five Years Later
This is the seventh in a series of stories over the coming weeks looking at various topics related to the response, the Natural Resource Damage Assessment science, restoration efforts, and the future of the Gulf of Mexico.
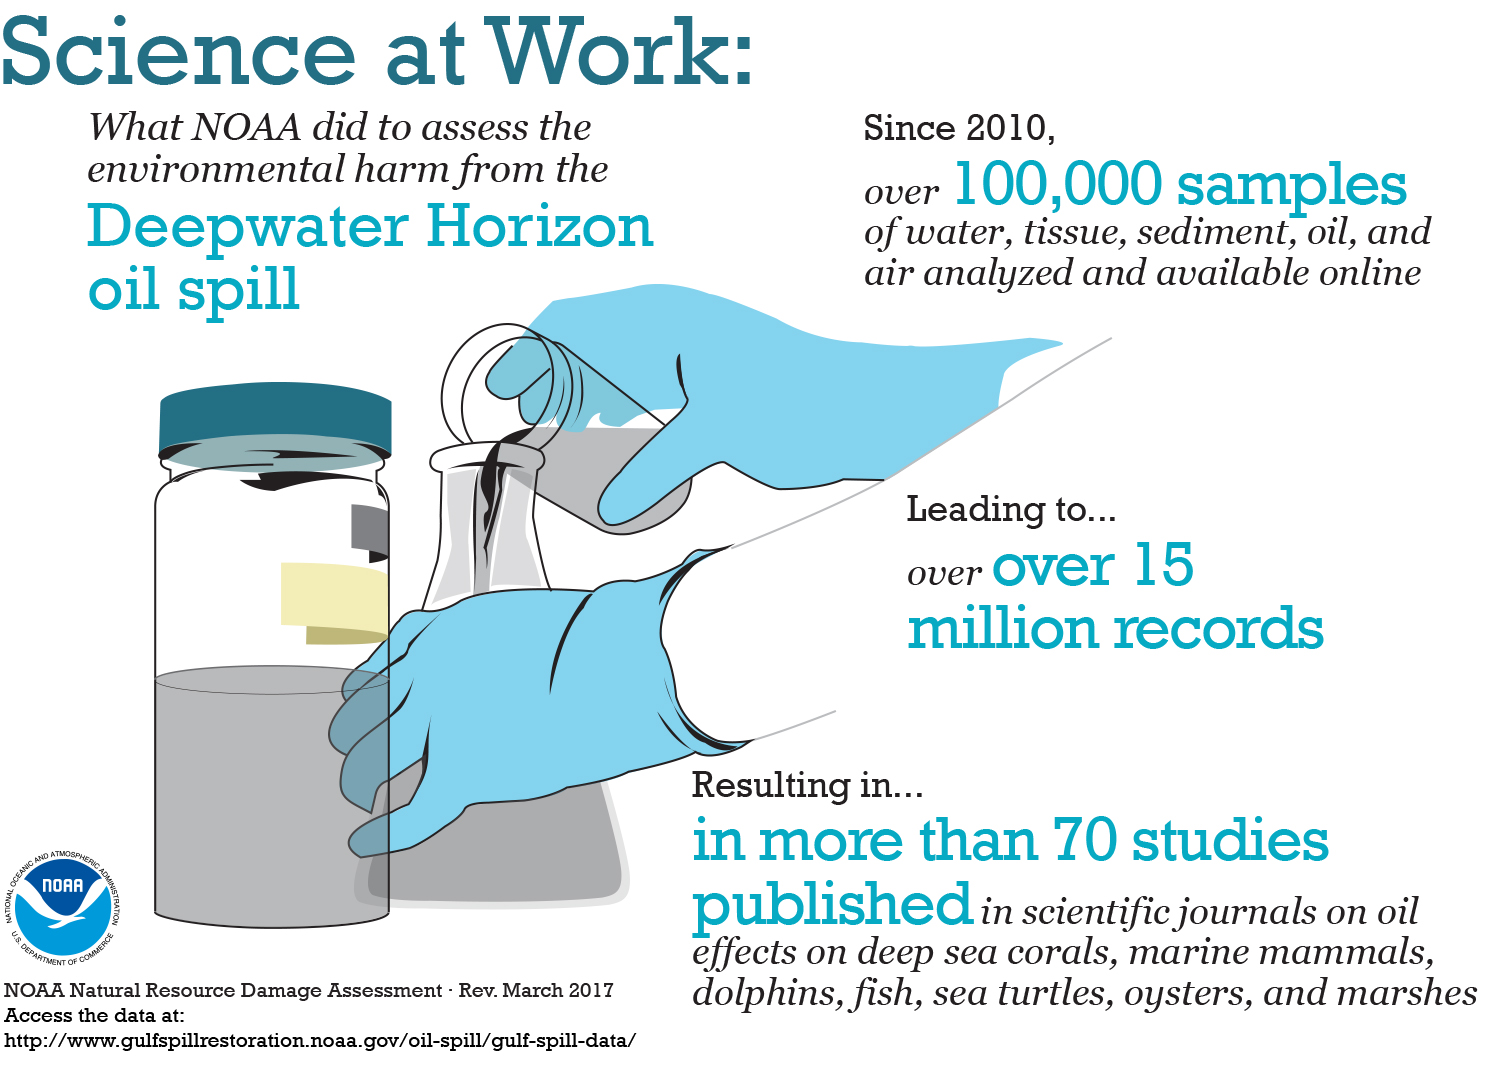
APRIL 17, 2015 — The Deepwater Horizon oil spill was the largest marine oil spill in U.S. history.
In the wake of this massive pollution release, NOAA and other federal and state government scientists need to determine how much this spill and ensuing response efforts harmed the Gulf of Mexico's natural resources, and define the necessary type and amount of restoration.
That means planning a lot of scientific studies and collecting a lot of data on the spill's impacts, an effort beginning within hours of the spill and continuing to this day.
Scientists collected oil samples from across the Gulf Coast. Oil spill observers snapped photographs of oil on the ocean surface from airplanes. Oceanographic sensors detected oil in the water column near the Macondo wellhead. Biologists followed the tracks of tagged dolphins as they swam through the Gulf's bays and estuaries.
Scientists are using this type of information—and much more—to better understand and assess the impacts to the Gulf ecosystem and people's uses of it.
But what is the best way to gather together and organize what would become an unprecedented amount of data for this ongoing Natural Resource Damage Assessment process? Scientists from across disciplines, agencies, and the country needed to be able to upload their own data and download others’ data, in addition to searching and sorting through what would eventually amount to tens of thousands of samples and millions of results and observations.
")
First, a Quick Fix
Early on, it became clear that the people assessing the spill’s environmental impacts needed a single online location to organize the quickly accumulating data. To address this need, a team of data management experts within NOAA began creating a secure, web-based data repository. This new tool would allow scientific teams from different organizations to easily upload their field data and other key information related to their studies, such as scanned field notes, electronic data sheets, sampling protocols, scanned images, photographs, and navigation information.
While this data repository was being set up, NOAA needed an interim solution and turned to its existing database tool known as Query Manager. Query Manager allowed users to sort and filter some of the data types being collected for the damage assessment—including sediment, tissue, water, and oil chemistry results, as well as sediment and water toxicity data—but the scope and scale of the Deepwater Horizon oil spill called for more flexibility and features in a data management tool. When NOAA's new data repository was ready, it took over from Query Manager.
Next, a New Data Management Solution
As efforts to both curtail and measure the spill's impacts continued, the amount and diversity of scientific data began pouring in at unprecedented rates. The NOAA team working on the new repository took stock of the types of data being entered into it and realized a database alone would not be enough. They searched for a better way to not only manage information in the repository but to organize the data and make them accessible to myriad scientists on the Gulf Coast and in laboratories and offices across the country.
Building on industry standard, open source tools for managing "big data," NOAA developed a flexible data management tool—known as a "data warehouse"—which gives users two key features. First, it allows them to integrate data sets and documents as different as oceanographic sensor data and field observations, and second, it allows users to filter and download data for further analysis and research.
Now, this data warehouse is a little different than the type of physical warehouse where you stack boxes of stuff on row after row of shelves in a giant building. Instead, this web-based warehouse contains a flexible set of tables which can hold various types of data, each in a specific format, such as text documents in .pdf format or images in .jpg format.
To fill this digital warehouse with data, the development team worked with the scientific and technical experts, who in many cases were out collecting data in places impacted by the oil spill, to establish a flow of information into the appropriate tables in the warehouse. In addition, they standardized formats for entering certain data, such as date, types of analysis, and names of species.
Manual and automated checks ensure the integrity of the data being entered, a process which gets easier as new data arrive in the warehouse and are incorporated into the proper table. The process of standardizing and integrating data in one accessible location also helps connect cross-discipline teams of scientists who may be working on different parts of the ecosystem, say marsh versus nearshore waters.
The NOAA team has also created a custom-built "query tool" for the data warehouse that can search and filter all of those diverse data in a variety of ways. A user can filter data by one or more values (such as what type of analysis was done), draw a box around a specific geographic area to search and filter data by location, select a month and year to sort by date sampled, or even type in a single keyword or sample ID. This feature is critical for the scientists and technical teams tasked with synthesizing data across time and space to uncover patterns of environmental impact.
Download the Data Yourself
NOAA's data warehouse currently holds validated damage assessment data from more than 53,000 water, tissue, oil, and sediment samples, which, once these samples were analyzed, have led to over 3.8 million analytical results, also stored within the new tool. Together, NOAA's samples and analytical results have informed more than 16 scientific studies published in peer-reviewed scientific journals, as well as many other academic and scientific publications.
While not all of the data from the damage assessment are publicly available yet, you can access validated data collected through cooperative studies or otherwise made available through the Natural Resource Damage Assessment legal process.
You can find validated data exported from NOAA's digital data warehouse available for download on both the Natural Resource Damage Assessment website and NOAA's interactive online mapping tool for this spill, the ERMA Deepwater Gulf Response website. Stay tuned for more about this new tool, including additional details on how it works and where you can find it.
This is a post by Benjamin Shorr of NOAA's Office of Response and Restoration.