 An official website of the United States government.
 Evolution of the ESI Map
")
NOVEMBER 21, 2014 -- Environmental Sensitivity Index (ESI) maps have been produced for over 35 years. Throughout that time, the cartographic product has seen some change (e.g., the addition of the “back of the map” species list, hatched polygons replacing range bars, and the grouping of resources at risk), but by and large, the ESI maps produced in the 80s look very similar to the maps produced in 2014. This is good!
It is a tribute to the ESIs that the format has stood the test of time. We pride ourselves on the fact that a responder in Hawaii can travel to Alaska for a spill, and easily interpret the ESI maps for that region, as they have the same look and feel as those in their home state. The ESI colors, icons, and composition are well recognized by planners and responders, and have been replicated internationally. There’s a lot to be said for consistency!
Increasing Amounts of Data
On the other hand, the content of the ESI data has evolved significantly over the past 35 years. Species have been added (there are currently over 4,000 species included in our master species list!), more data are available digitally, attributes have been added, and more human-use data are collected. While maintenance of the digital data presents less of a challenge, the production of maps that convey the essential information readily and accurately has become increasingly difficult. It has become harder to decipher the shoreline types due to the abundance of biology polygons, and for the same reason, it has become harder to identify which are the more vulnerable populations and where they occur.
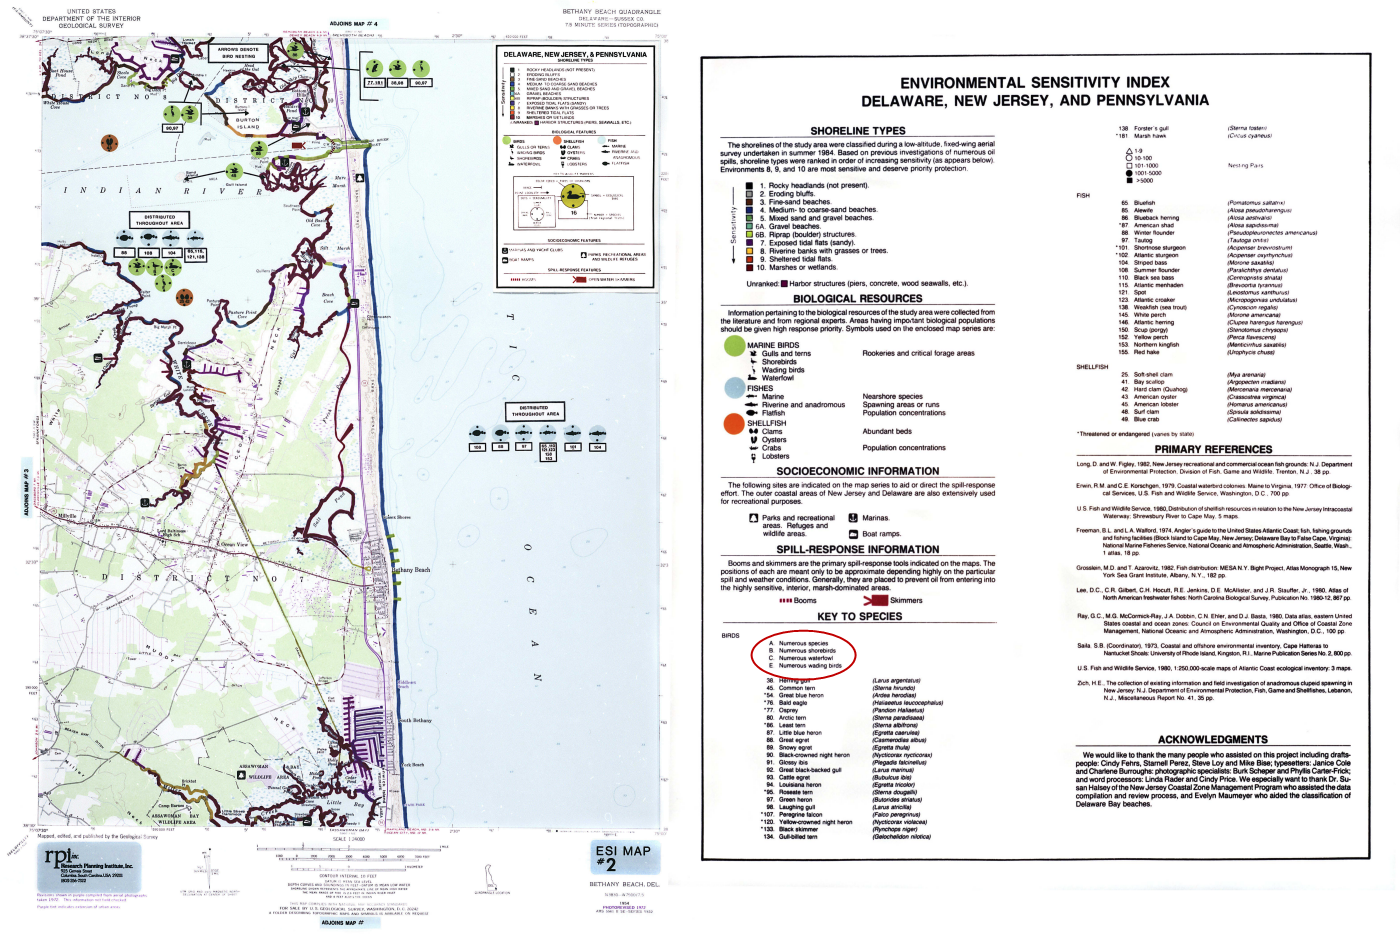
Most populations were mapped by species, with the species key printed in the Introductory pages. Limited assemblages were mapped (circled above) and were very general (A = numerous species). Click to view larger.
Increasing Technology Demands
Add to that the evolution of technology. The first ESI maps were produced manually. Next came Desktop ARC/INFO, followed by workstation ARC/INFO (versions 5.x, 6.x, and 7.x) and ArcView 3.x, then the whole new line of ArcGIS products (vs. 8.x-10.x). That’s a lot of change! Through all the software releases, ESI maps continued to be produced. Unfortunately it is unrealistic, if not impossible, to port all the code and procedures used to create the maps to every version update. Consequently, some of the map processes still rely on software versions that are reaching obsolescence. For all these reasons, it is time to reevaluate the ESI map products and the map-making process.
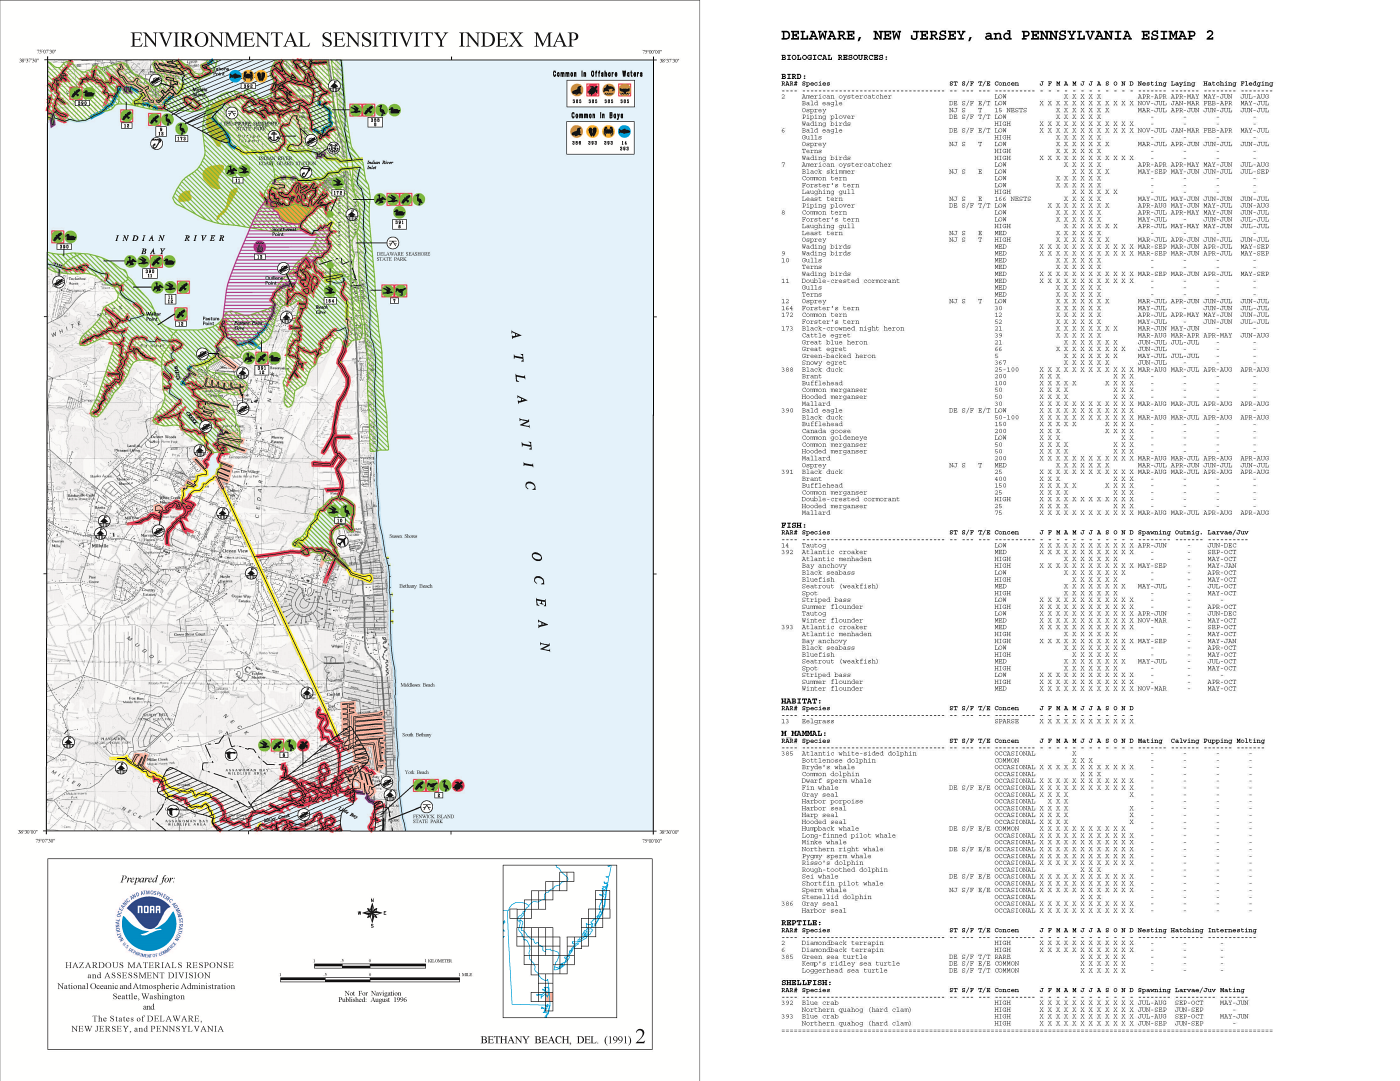
Species were now mapped as assemblages, linked by the resource at risk (RAR) number to the “back” of the map. There, a summary of the species found in each grouping is detailed, including their seasonality, concentration, and life stage activities. Click to view larger.
In conjunction with the Sandy-related ESI mapping on the east coast, NOAA initiated a contract with Photo Science, a Quantum Spatial company (QSI), to evaluate and update the current ESI map and PDF formats. Their first task is to make recommendations on how we might better portray the ESI data. We don’t want to change things that work, but rather, hope to find ways that make them work better with the current ESI data. The goal is a high quality map and PDF product, yet one that can be produced in a cost effective fashion.
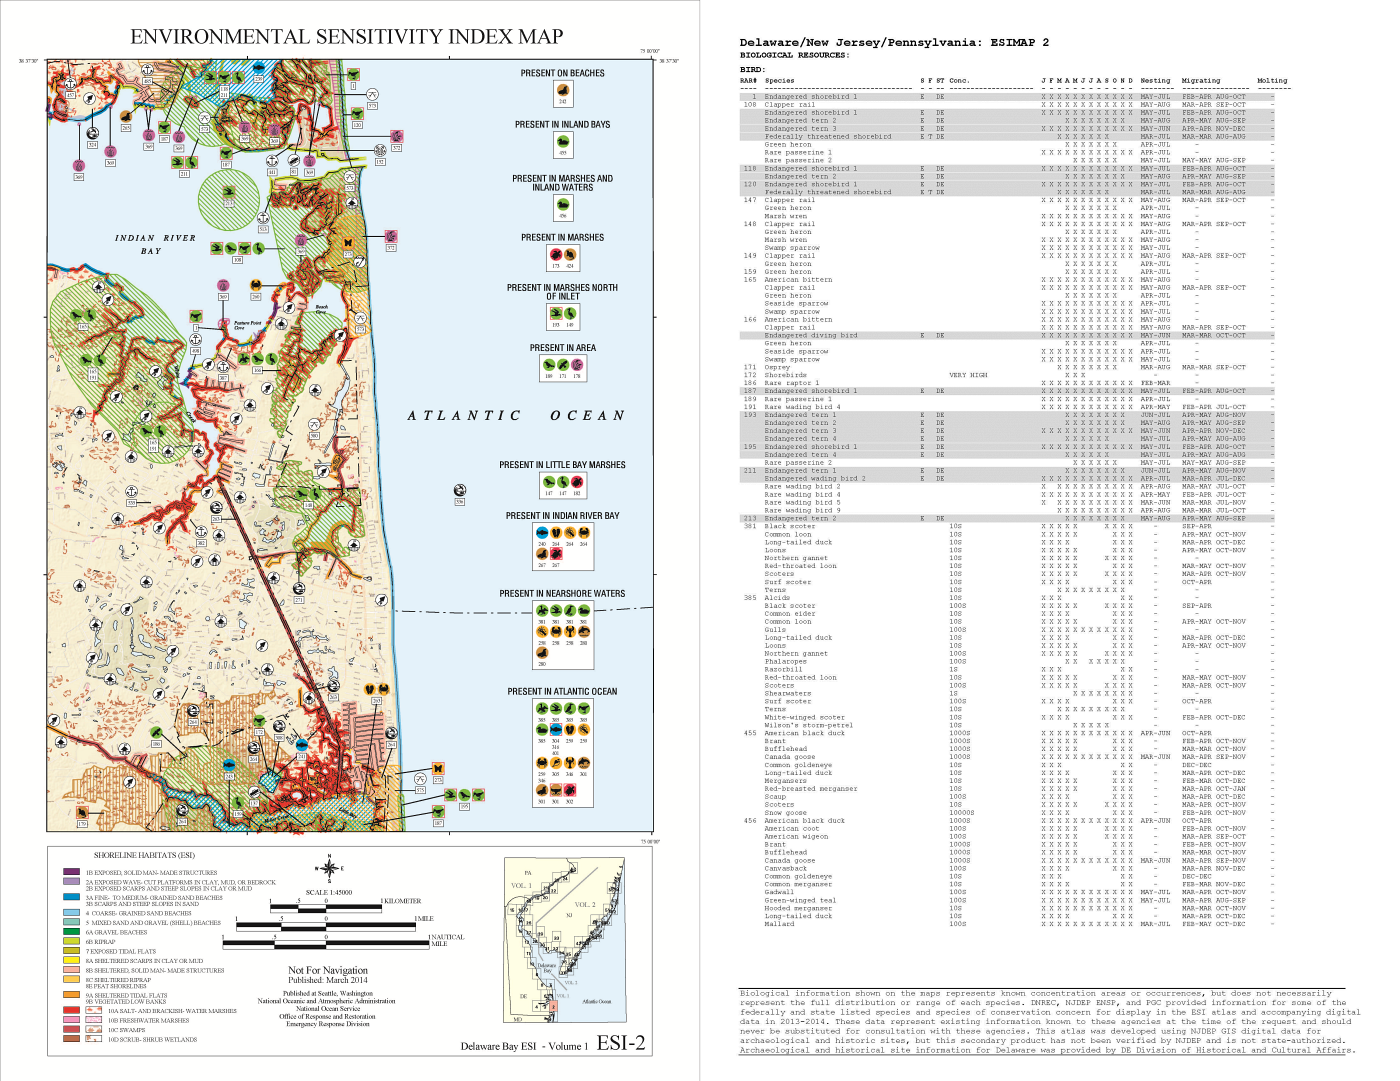
The format and details have changed little since the 1996 mapping; however, the number of species included has grown considerably. In 1996, the “back of the map” fit on one page; in 2014, the resource details expanded to fill 4 pages, despite using a smaller font. Click to view larger.
Refining What ESI Users Want and Need
As a first step in this process, OR&R created a User Survey, focusing on the current hard copy map and PDF products. The survey was distributed to federal and state oil spill responders. The survey questions highlighted what information they sought from the ESI maps, what attributes they focused on when evaluating protection priorities, and what features in the current maps they liked best and least. Along with multiple choice questions, there were several opportunities for survey respondents to express their opinions in free text on a variety of topics. Not surprisingly, some of the answers overlapped with general ESI content considerations, making the survey useful for evaluating the ESIs beyond the intended hard copy map focus.
QSI analyzed the survey results, and produced a summary of their findings. Though some of the results were predictable, the analysis highlights some of the more subtle ways the maps are used. It wasn’t surprising that almost all respondents targeted the Threatened and Endangered species in their response considerations, but the survey also showed that the life stage seasonality was one of the lesser used attributes. Why might this be? Is it because it’s more detail than needed? Or is it because that information is hard to extract from the maps? If the latter is true, is there a way we can highlight those activities that would make them more accessible? There are many things to take away from the survey and much to consider. For more details, the survey review, as well as the complete survey results [PDF, 808 KB], is available for viewing on this website.
We will keep you updated as the map and PDF design unfolds. Until then, if you have thoughts on what you’d like to us to consider, feel free to send an email to ORR.ESI@noaa.gov.