 An official website of the United States government.
 PDF Maps for the Florida Panhandle
APRIL 4, 2013 -- Florida Fish and Wildlife Conservation Commission and NOAA OR&R recently took delivery of the digital Environmental Sensitivity Index (ESI) data for the Panhandle of Florida. Unlike most ESI projects, hard copy and PDF maps were not part of the contractor’s deliverable. Instead, all contract funding was focused on the actual acquisition, collection, and synthesis of the ESI data.
Though we seem to be transitioning to a largely “digital world,” PDF/printable maps are still the format of choice for many. To try to meet the needs of that user group, we used the ArcMap Seasonal Summary tool, in conjunction with some supporting Python scripts, to develop a PDF ESI atlas project for the Panhandle, similar to what we have published for other areas. Check out the new Florida Panhandle PDF maps on our ESI Downloads page.
The New ESI Product
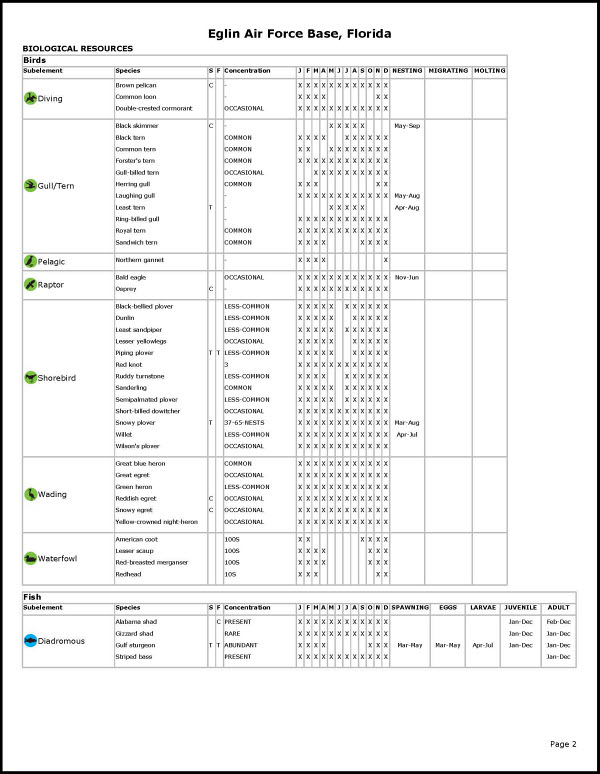
Although the new “on the fly” maps created with the Seasonal Summary tool are similar to OR&R’s existing PDF maps, there are some subtle differences. The new maps show the ESI shoreline and polygons, and the “back of the map” summarizes the biological, human-use, and shoreline resources found in the area; however, these maps are less complex than their predecessors, and locational information less refined.
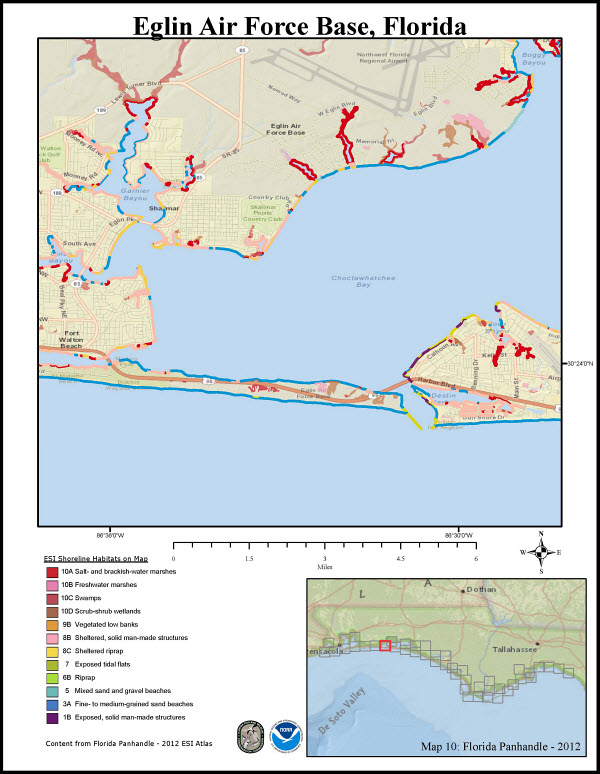 One of the outcomes of last year’s ESI user survey and Workshop were many good presentation suggestions, based on some examples of a simplified ESI map. Workshop participants recommended that we include a locator map and some coordinate reference marks, both of which have been integrated into the current map layout. The participants also had suggestions about the resource summaries, with the majority of them preferring the traditional layout, particularly for the seasonality. Those suggestions were also taken into consideration when designing the “back of the map.”
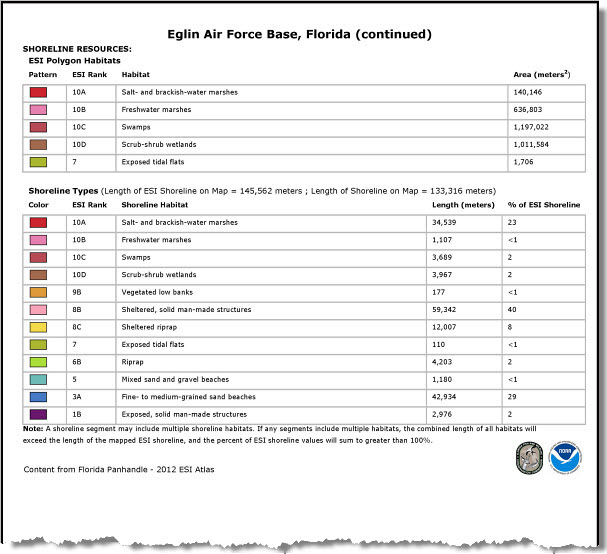
 A new feature on these maps is a summary of the shoreline resources. The summary provides the length of shoreline on the map, as well as the length and percentage of each shoreline type. Of course, the length measurements are influenced by the scale of the underlying data, so the numbers may seem larger than what you would expect to see if all the “ins and outs” of the shoreline were ignored. The percentage of each shoreline type present is relatively independent of the mapping scale.
Sample ESI map page
Sample of biology summary—the “back of the map”
Sample summary of shoreline resources
Next Up
The State of Florida has been hard at work extending the functionality and data content of their Florida Marine Spill Analysis System (FMSAS), in which ESIs play a crucial role. Hopefully, in the not too distant future, they will be willing to post on this blog about some of this work. I will also try to find some time to write up a brief description of the Seasonal Summary/“Maps on the Fly” tool—its functionality and limitations—and how it might work for you!
Questions: As always, contact the ESI Specialist with questions, comments, or suggestions about ESI maps and data.
Last updated
Tuesday, November 8, 2022 1:46pm PST