What’s New in ERMA®: Enhanced Data Accessibility, New Sensitivity Mapping Data, and more.
NOV. 26, 2024 — This fall, the NOAA Office of Response and Restoration released a new version of the Environmental Response Management Application (ERMA®). ERMA is a web-based mapping application used by environmental responders and natural resource decision-makers. It serves as the Common Operational Picture, or COP, for NOAA and the U.S. Coast Guard, as well as other state and federal agencies, during environmental disaster response and cleanup. Below, we’ve highlighted key enhancements in the recent release, including a host of new features and optimizations.
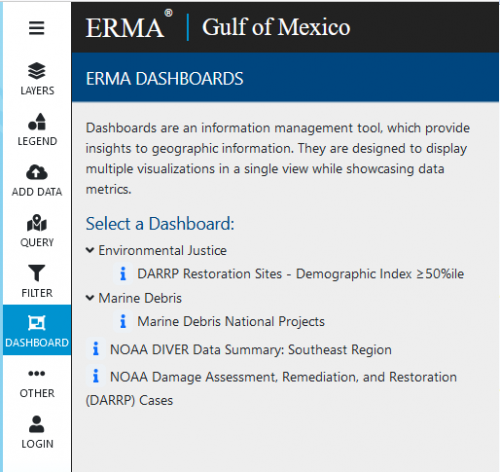
Dashboards Enhancements
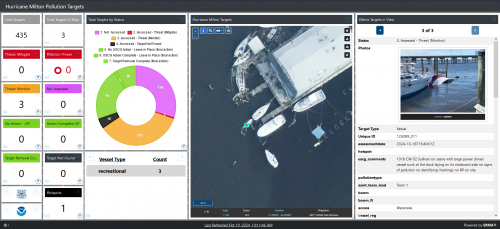
The latest ERMA dashboard update introduces several new features designed to improve user experience and data accessibility. A photo carousel now offers a visually engaging way to browse images, while tab cards provide an organized, at-a-glance view of key data points. Button placements within ERMA have been updated for a more intuitive layout, and users now have added abilities to display percentage values alongside raw data and apply new sort options to streamline data analysis.
View Data Export
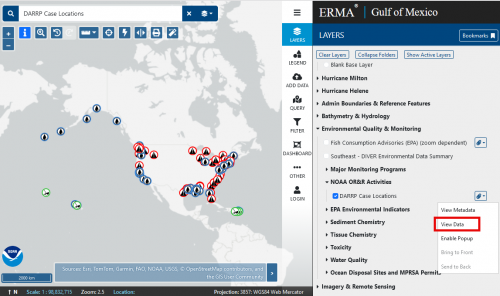
Users can also now export data directly from the View Data table, making data sharing and analysis more accessible than ever before. To find the View Data option, find a layer, hover over, and right click on the layer. Users can also find this option by clicking on the vertical ellipsis.
From the View Data table, users can apply additional filters before data export. In the upper right-hand corner is a menu where the Export Layer Data option lives. Accessing this option prompts terms of use that must be agreed upon before proceeding, as well as the different formats data can be exported in.
ESI Tool Updates and New Data Atlases
The latest ERMA update also includes a number of Environmental Sensitivity Index (ESI) changes. In partnership with the Bureau of Safety and Environmental Enforcement (BSEE), ERMA has expanded its coverage by publishing offshore ESI data atlases for the Gulf of Mexico, Southern California, and Alaska. The new offshore atlases contain the same ESI data but for offshore areas in these regions. This data can be queried in ERMA along with the shore-based ESI atlases. ESI source data, metadata, reports, maps, and links to ERMA and ArcGIS online are all available from the OR&R website.
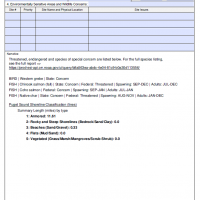
Additional ESI improvements included enhancements to the ESI report, which introduces the ability to create a Resources at Risk (RAR) Summary (ICS-232) Report. ICS-232 is one of the U.S. Coast Guard Incident Command System (ICS) Authorized forms used during an incident or in drills. The ERMA ESI Query tool will provide a preliminary report on threatened, endangered and species of special concerns, shoreline classification, managed resource areas, and socioeconomic information. Unique layers within the table of contents have been created for all ESI atlases that represent the extent of data for threatened and endangered species. This allows for more precise mapping and analysis providing valuable data for these sensitive marine areas.
Users can go to the Query Tool Menu and draw a polygon of the area they would like to generate an ESI report. The months are preselected for a timeframe of a month before and after the current date. Select additional months, if necessary, and the biological and other information desired for viewing, then click Run Query. The ESI RAR report page is generated. On the right hand side above the inset map is the option to “Download ICS232 PDF” form. The Environmental Unit Lead (EUL) with the resource trustees would fill in the additional information. A three-page report of the ICS-232 fillable form with the ESI information prefilled will be generated based on the polygon area drawn.
Future Updates
While this announcement highlights some of the major updates in ERMA’s latest release, users are encouraged to explore the application further to experience all that is new. Stay tuned for future ERMA releases announced on OR&R’s website, as OR&R is committed to providing seamless display, visualization, and data investigation tools for environmental disaster management.
more images


 An official website of the United States government.


