CAMEO Suite Stats, Fiscal Year 2022, Q1-Q3
AUG. 1, 2022 — This is the first of a new quarterly series on the public use of the CAMEO Suite. Our goal is to tell a more complete story here rather than just the “numbers,” getting into more of what they mean.
To those less familiar with the CAMEO Suite, it is a set of software tools designed to assist emergency planning and response — especially for events related to hazardous chemicals. It is comprised of five applications, ALOHA, CAMEO Chemicals, CAMEO Data Manager, MARPLOT, and Tier2 Submit. Of these, all are available for Windows and Mac, while CAMEO Chemicals is also available as a website and iOS and Android apps.
You may be surprised by the number of desktop applications that comprise the CAMEO Suite. This was an intentional choice. With the software mainly focused on emergency response, these tools must be available and functional without an internet connection. Many CAMEO users are in rural locations and are part of volunteer response teams with limited budgets.
Additionally, for the purposes of these reports, we'll be looking at data from Oct. 1, 2021 to June 30, 2022, or Quarter 1, 2, and 3 of the federal government fiscal year 2022.
The numbers
These two charts detail the raw numbers of both users downloading CAMEO software and visiting the CAMEO Chemicals website. They're telling slightly different stories between the two.

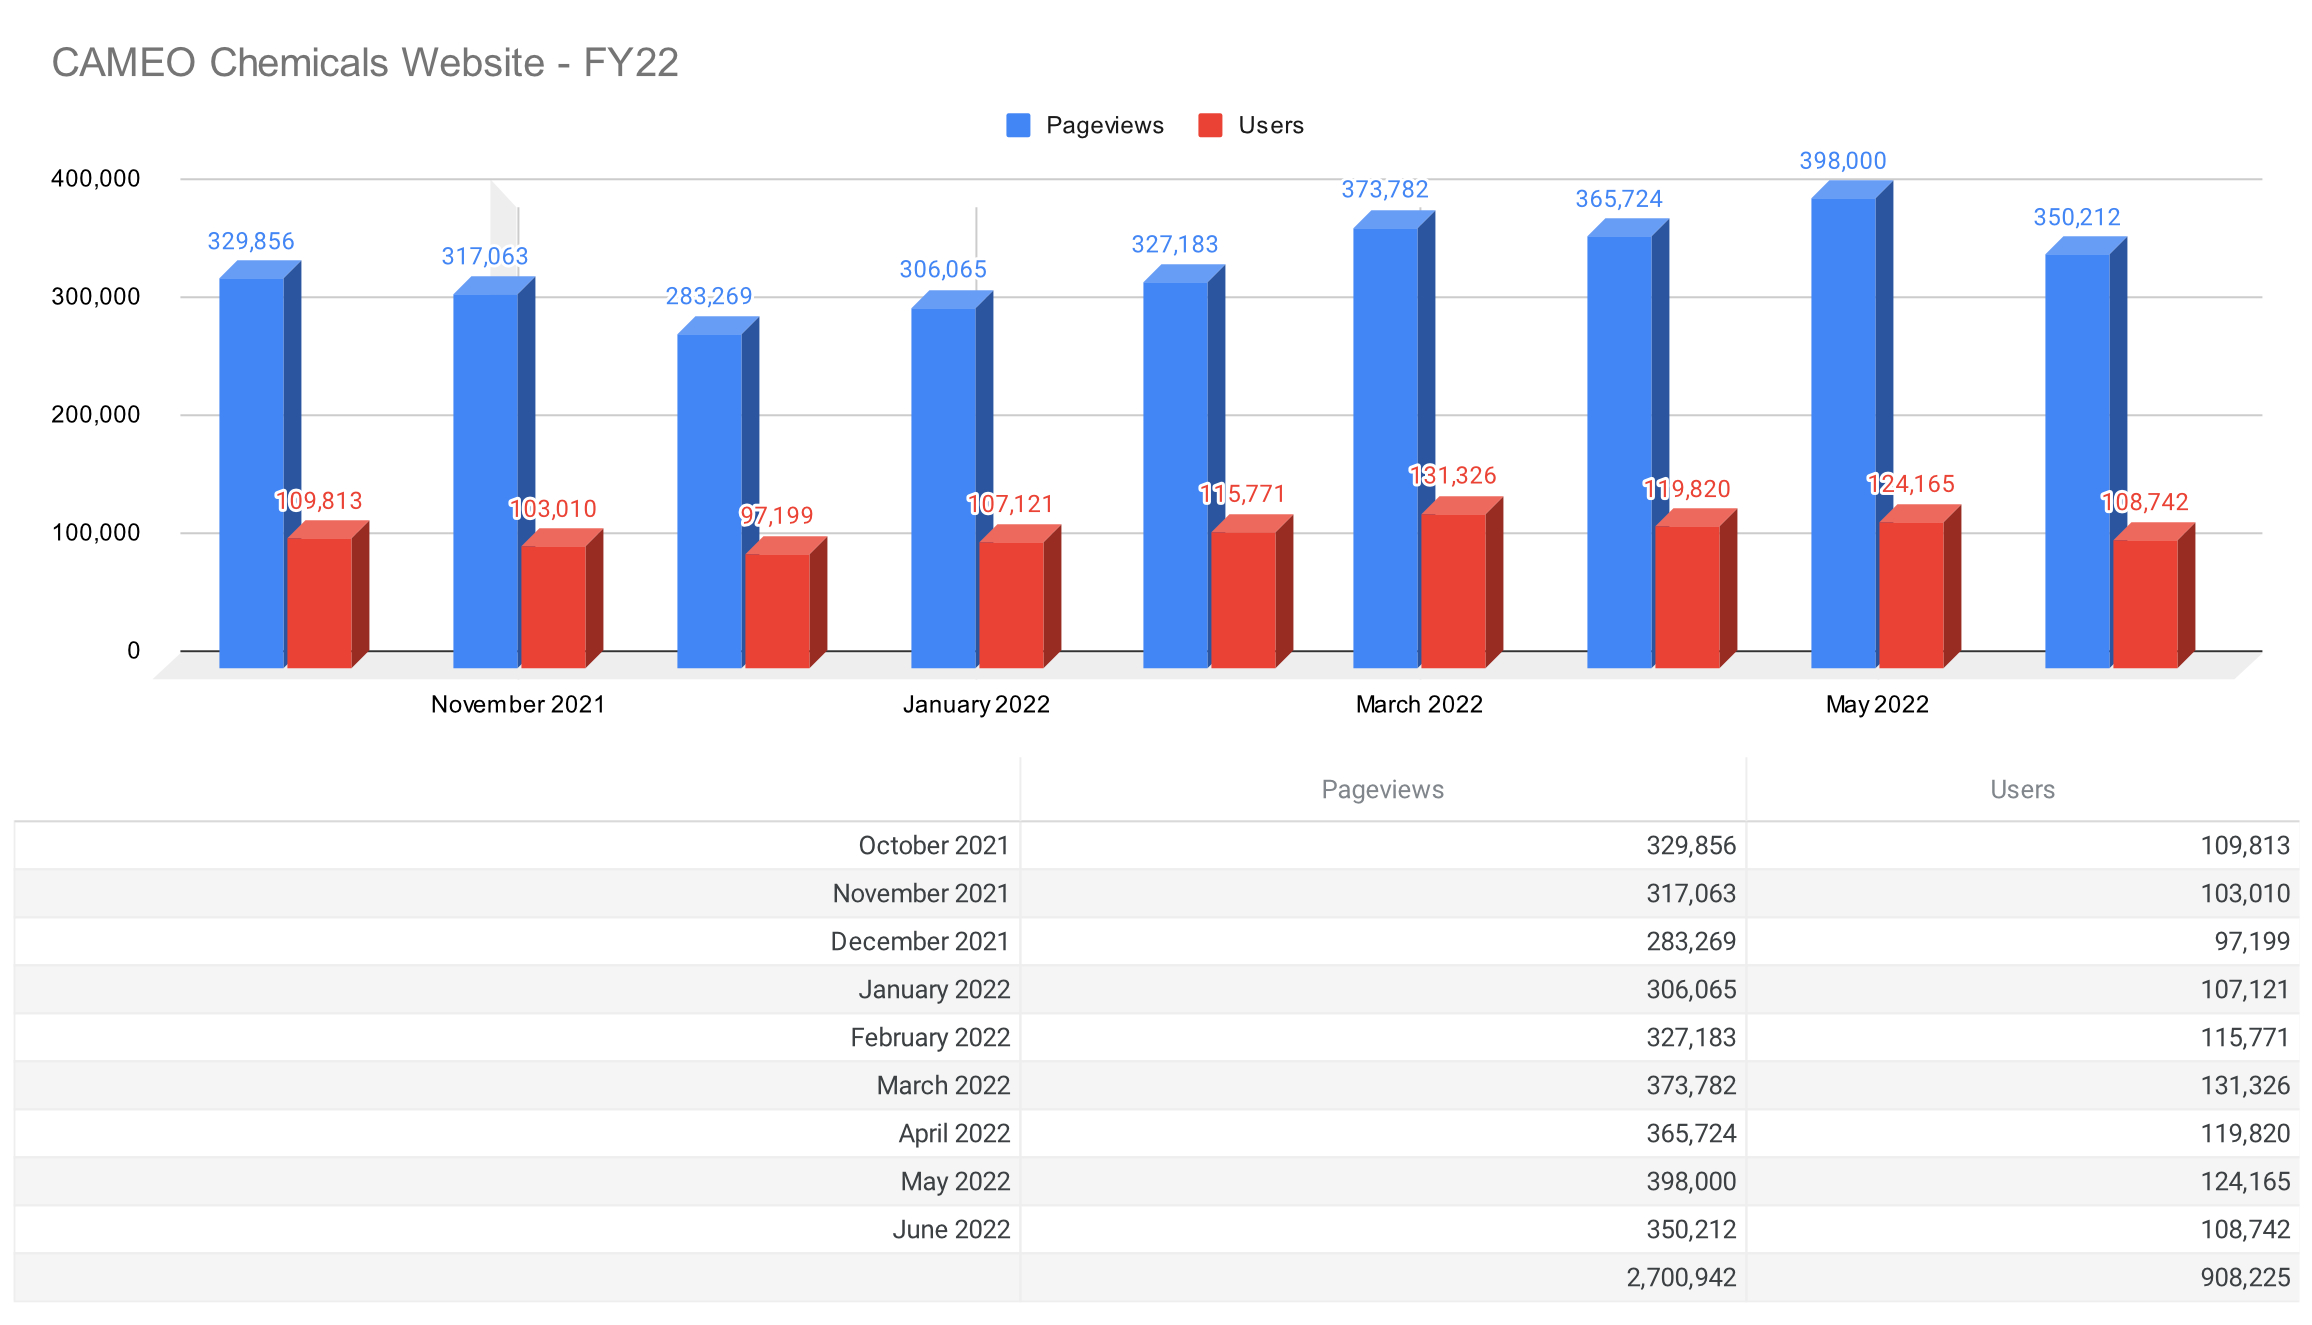 Pageviews and users of the CAMEO Chemicals website. Pageviews are the number of pages viewed by a human. Users are the number of people behind those views. Image credit: NOAA.
The stories
Using the generalized numbers, we see a couple interesting happenings in January and February 2022. Tier2 Submit has a significant spike leading up to the March 1 Tier II reporting deadline. Each year we work with the EPA and the states to update Tier2 Submit and CAMEO Data Manager with regulatory changes both on the federal and state level. The releases of these two pieces of software usually happens sometime in November, but was pushed later this cycle, happening in December 2021 instead (noted with the two ★ icons). This caused the download spike to be more pronounced this time.
Still looking at the downloads chart, in April another release happened, this time CAMEO Chemicals (noted with a single ★). Usually one of our more popular applications regularly, when the update released, downloads jumped to 46,303 in a single month, the majority of which went to iOS devices. We don't always have as much time as we would like to get updates out to our users, but it's really encouraging to see them immediately updating when we do.
Looking behind the scenes at more specific data points, we can see that our software is used in over 23,000 cities internationally, and more than 10,000 cities nationally. Within the United States, there's a strong bias towards the southern and eastern states, however, California is a hotspot outlier on the west coast.
Where we get the data
As is standard policy for all NOAA websites, we include a Google Analytics tracking script. This means that for the majority of our software, we only get an idea of how much it's being downloaded, but not how it's actually being used due to their being desktop applications. Though, in the case of CAMEO Chemicals, we do have that broader picture because of its availability as a website.
This process is fully anonymized and does not collect any Personally Identifiable Information. Further details can be found in CAMEO’s privacy policy.
For more information on use of the CAMEO suite tools, please contact Naomi.Wilkins@noaa.gov.