NOAA Damage Assessment, Remediation, and Restoration Program: Learn About Our Work in Your State
Submitted by alyssa.gray on
 An official website of the United States government. Here's how you know we're official.
A .gov website belongs to an official government organization in the United States.
A small lock or https:// means you’ve safely connected to a .gov website. Share sensitive information only on official, secure websites.

Submitted by alyssa.gray on
Submitted by alyssa.gray on
Submitted by alyssa.gray on
Submitted by alyssa.gray on
Submitted by vicki.loe on
Submitted by alyssa.gray on
Submitted by alyssa.gray on
Submitted by alyssa.gray on
Submitted by alyssa.gray on
Submitted by alyssa.gray on
Submitted by alyssa.gray on
Submitted by alyssa.gray on
Submitted by alyssa.gray on
Submitted by alyssa.gray on
Submitted by alyssa.gray on
Submitted by alyssa.gray on
Submitted by alyssa.gray on
Submitted by alyssa.gray on
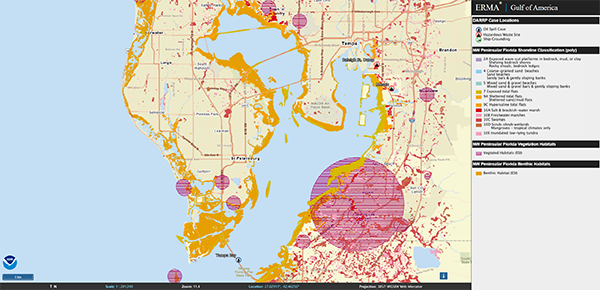
Shown in this map are the locations of NOAA’s Damage Assessment, Remediation, and Restoration Program Cases in Tampa Bay along with ESI shoreline, vegetation habitat, and benthic habitat.
ESI data contains a wealth of information that can be leveraged for planning, response, and restoration activities. The outcomes from the virtual workshop will make NOAA ESI data valuable for years to come by streamlining the data collection process as well as focusing on what is important to Natural Resource Advisors.
Visit the Gulf of America ERMA to explore the ESI maps and case locations.
Submitted by alyssa.gray on
