 An official website of the United States government.
 Biological Resources
Some animal and plant species are especially vulnerable to oil spills. The Environmental Sensitivity Index (ESI) method classifies these species into categories and displays their locations on ESI maps and provides detailed information about their seasonality, concentrations, and breeding activities.
To see the full list of biological resource categories and map symbols, click the Resources on ESI Maps link at the top of the page. Also, the ESI Species List lists all of the species that may be shown on ESI maps.
Many species that are vulnerable to oil are wide-ranging, and may be present over large areas at any time. These species can be especially vulnerable at particular times and places.
Animals and their habitats tend to be most at risk from oil spills when:
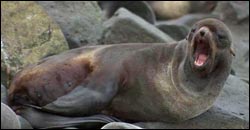
- Many individuals are concentrated in a small area, such as a seal haulout area or a bay where waterfowl concentrate during migration.
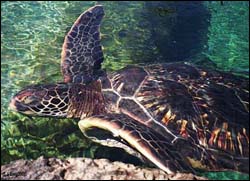
- Early life stages are present in certain areas, such as seabird rookeries, spawning beds used by anadromous fish, or turtle nesting beaches.
- Oil affects areas important to specific life stages or important for migration, such as foraging or over-wintering sites.
- Specific areas are critically important for propagation of a species.
- A particular species is threatened or endangered.
- A substantial percentage of an animal or plant population is likely to be exposed to oil.
ESI maps show where these most sensitive species, life stages, and locations exist, but ESI maps don't necessarily show the entire area where members of a sensitive species occur.
Note: Because showing the locations of certain endangered species on public maps could potentially result in increased visitation and possible disturbance or vandalism, the exact locations of such species may not be shown on ESI maps. At the discretion of state and local officials, the species may be shown by placing a symbol somewhere within a designated radius of the actual location or the species may not be shown at all.
For each species, the back of the ESI maps and the GIS data tables include the following information (when known):
 |
|
This information is intended to be used by oil spill planners and coastal zone managers. For example, the manager of a particular area may need to identify the seasons when a particular species is most vulnerable, so that he or she can set protection priorities for different seasons.
More Information about ESI Maps
Anatomy of ESI Maps: Learn about the basic elements of ESI maps.
Shoreline Rankings: Learn how shorelines are ranked on ESI maps according to their sensitivity to oil, the natural persistence of oil, and the expected ease of cleanup after an oil spill.
Human-Use Resources: Learn how ESI maps categorize and display the location of human-use resources (such as public beaches) that are vulnerable to oil spills, or that could be used as access points for oil spill cleanup.
Related Publications
Oil and Sea Turtles: Biology, Planning, and Response: This report provides a basic overview of sea turtle biology, and summarizes what is known about the effects of oil on sea turtles.
Oil Spills in Mangroves: Planning and Response Considerations: This 2002 report summarizes current research on mangrove ecosystems for spill response decision-makers.
Oil Spills in Coral Reefs: Planning and Response Considerations: This 2001 report summarizes relevant research on coral reefs. It was written for anyone working in or planning for spill response in coral reef regions.