Trajectory Analysis Planner (TAP)
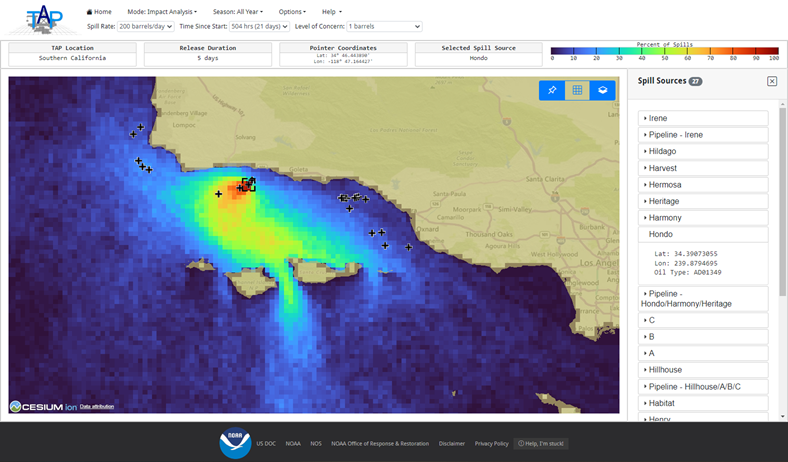
Trajectory Analysis Planner (TAP) is a software tool designed to help answer crucial questions in any Area Contingency Plan:
- How do I develop a plan that protects my area against likely oil spills?
- What are the chances that an oil spill from a source in a region will affect a certain resource?
- How long would responders have to respond to a spill successfully?
- How much oil could impact a specific resource?
Background
To prepare for possible oil spills from likely sources, NOAA’s Office of Response and Restoration developed the Trajectory Analysis Planner. TAP uses thousands of runs of the GNOME trajectory model, forced with varying winds and ocean currents in order to develop a statistical view of where oil is likely to go in the event of a spill. This allows for improvements in planning and preparedness for prevention of harm from oil spills. The TAP tool has previously only been available as a desktop application, but is now available as a web application—WebTAP—making it much more flexible, and easier for planners and responders to access. Also, all previous TAP projects are hosted and available in the application.
What TAP Does
TAP presents graphical output in four modes:
- Shoreline Impact Analysis helps to answer: If oil is spilled at a given spot, what shoreline locations are likely to be affected?
- Response Time Analysis helps you estimate how quickly a response must be mounted at a location of concern to precede the arrival of the oil.
- Site Oiling Analysis helps you visualize how a location of concern would likely be oiled by a spill at a given location.
- Threat Zone Analysis helps to answer: Where might a spill occur that could threaten a particular location of concern?
How TAP Works
TAP is used to estimate the probability that an oil spill from a likely source will reach a specific segment of shoreline. TAP analyzes statistics from potential spill trajectories generated by the NOAA OR&R oil spill trajectory model, GNOME (General NOAA Operational Modeling Environment). This model predicts how an oil spill will spread and move within a local area. It takes into account:
- The bathymetry (water depth) and shoreline configuration of a particular body of water, including its channels, bays, and significant rivers.
- Currents and winds.
- Shoreline characteristics that determine beaching and refloating of oil.
To develop a TAP dataset, the GNOME model is used to generate hundreds of individual oil spill trajectories from a set of potential spill locations. Then statistics are compiled for where, when, and how much oil could impact receptor sites into data files.
TAP displays a map of a specific local area, including a major water body and the adjacent land. The map displays shoreline segments or an ocean grid (receptor sites) that represent the locations of shoreline resources, such as seabird colonies or marine mammal hauling grounds; sites of particular socioeconomic value, such as tourist beaches or large marinas; or areas where remediation measures would be difficult or expensive. You can use TAP to evaluate the probable threat to any of these sites from an oil spill that originates from likely sources in the region.
TAP for Specific Regions
Versions of TAP have been developed for a number of locations, which can be found online in WebTAP. Those TAP locations are still available for download if you don’t wish to view them in WebTAP.
More Information about TAP
TAP Fact Sheet [PDF, 488 KB]: This short fact sheet describes the Trajectory Analysis Planner (TAP) in more detail.
The NOAA Trajectory Analysis Planner: TAP II [PDF, 142.8 KB]: This short paper describes the history of TAP and TAP II, and the methodology and display modes of TAP II.
Additional resources, such as the following poster presentations, are available upon request (orr.tap@noaa.gov):
Righi, D., E. Ammann, J. Lehto, G. Watabayashi, A. MacFadyen, C. Barker, "Arctic Oil Spill Trajectory Analysis Planner." Poster presented at Alaska Marine Science Symposium; January 2019, Anchorage, AK.
Zaleski, S., G. Watabayashi, C. Dong, C.H. Barker, A. MacFadyen, D. Righi, G. Kachook, B. Zelenke, "Simulating Oil Spill Transport at the Sea Surface Offshore Southern California." Poster presented at the International Oil Spill Conference; May 2017, Long Beach, CA.
Related Resources
GNOME Suite: Oil spill planners and responders use a suite of oil trajectory and weathering tools known as GNOME, to predict how wind, currents, and other processes might move and spread pollutants that have spilled on or in the water. GNOME is used to compute the oil spill trajectories used by TAP.
Environmental Sensitivity Index (ESI) Maps: To decide which areas in a given region are most important to protect and eventually to clean up, responders use our Environmental Sensitivity Index (ESI) maps of the region. You can obtain electronic ESI maps for most regions of the U.S.
ADIOS Oil Database: A web-based interface for accessing physical and chemical information on a wide variety of petroleum products. Oil records can be downloaded and used in spill modeling scenarios in GNOME.
Trajectory Analysis Handbook: A publication for spill responders and planners describing the basics of analyzing the forecasted trajectory of spilled oil, including an overview of the physical processes that affect oil movement and behavior in the marine environment. Available in English and Spanish.
Acknowledgement: The work to develop WebTAP was sponsored by the Bureau of Ocean Energy Management (BOEM).
Questions: Contact us with questions, comments, or suggestions about TAP.
 An official website of the United States government.
