Let Maps Open up the World Around You on GIS Day
NOVEMBER 20, 2013 -- Happy GIS Day! Today, GIS events are being hosted around the globe to highlight and celebrate the transformational role of Geographic Information Systems, or GIS.

GIS is mapping software that can display multiple sets of location-based information onto a single map.
Viewing information this way can help you visualize lots of data and identify trends and relationships, such as the potential health impacts of living near power plants and major highways, or how many pizza places are within 10 miles of your house.
Like offices and agencies around the world, we in NOAA's Office of Response and Restoration use GIS in our everyday work. Take a look at a few of the ways we use GIS—and you can too—to reduce environmental threats from coastal pollution.
Mapping Environmental Sensitivity
One of our teams is developing Environmental Sensitivity Index (ESI) maps using GIS technology to integrate and share information about sensitive shoreline resources, such as birds, wildlife, fisheries, and public beaches. Historically used for oil and chemical spill response and planning, these maps have become effective tools in preparing for and responding to storms, hurricanes, and other coastal disasters.
ESI data are published in a variety of GIS formats, including a file geodatabase and map document, that simplify their use within the GIS program ArcMap. Users can query data for their region to see what species are present in January, where threatened and endangered species live, what shoreline types are present, etc. You can download ESI data and ESI tools from our website and use them yourself.
Mapping Resources during a Disaster
MARPLOT is the mapping component in CAMEO, our software suite of tools for chemical spill response, which we develop with the U.S. Environmental Protection Agency (EPA). It's a free and easy-to-use GIS system that emergency responders and planners use to display information from other programs in the CAMEO suite. This could mean mapping estimates of high-risk areas for toxic chemical clouds (from ALOHA) or the locations of chemical production and storage facilities in relation to schools and hospitals (from CAMEOfm).
MARPLOT can also be used as a general mapping tool, which allows users to add objects, move around the map, and get population estimates. Some users have adapted MARPLOT, which operates without an Internet connection, for use during tornado response, search and rescue operations, and emergency planning. The development team is working on a major revision to MARPLOT, which will include access to global basemaps, enhanced web-based features, and additional data management capabilities.
Mapping Environmental Response
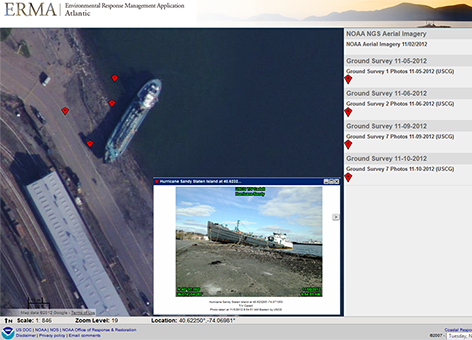
Web mapping for environmental response, such as oil spills, has come a long way in the past decade. NOAA is a leader in this digital mapping revolution with ERMA®, the Environmental Response Management Application, which we designed with the University of New Hampshire's Coastal Response Research Center and the EPA. It's an online mapping tool offering comprehensive access to environmental response information and is customized for many coastal areas of the U.S.
ERMA integrates both static and real-time data, such as ESI maps, ship locations, weather, and ocean currents, in a centralized map for use during a disaster such as an oil spill or hurricane. It provides environmental responders and decision-makers with up-to-date information for planning, response, assessment, and restoration activities. The application incorporates data into a convenient, web-based GIS mapping platform that can be accessed simultaneously by a variety of users via the Internet.
ERMA Deepwater Gulf Response is currently assisting with the ongoing response operations for the 2010 Deepwater Horizon oil spill in the Gulf of Mexico. Data related to this oil spill is displayed here and updated daily. In the northeast, Atlantic ERMA provided support to the Post Tropical Cyclone Sandy pollution response along the coast of New Jersey, New York, and Connecticut.
To the far north, Arctic ERMA has been used to integrate and display response-related information from oil spill technology demonstrations aboard an icebreaker in the remote Arctic Ocean and to display the data and high resolution imagery of the ShoreZone project, which seeks to map all 46,600 miles of Alaska’s coastal habitat and features. You can view all of the regional ERMA sites on our website.
Discover Your World
You can explore on the GIS Day website some of the amazing stories that GIS can help tell:
- Take a visual tour of the impacts of the September 2013 floods in Longmont, Col.
- Learn where in the U.S. fracking (hydraulic fracturing) is being used to mine natural gas from shale rock.
- View the devastation of Typhoon Haiyan in the Philippines.
 An official website of the United States government.
