 An official website of the United States government.
 NOAA Helps Reverse Pollution Woes for Two Florida Wetland Areas
Short title:
NOAA Helps Reverse Pollution Woes for Two Florida Wetland Areas
Big Worries from Fertilizer Slurries
On September 5, 2004, Hurricane Frances made landfall on the east coast of Florida and swept across the state, passing near Tampa Bay as a tropical storm. High winds and heavy rainfall associated with the storm damaged an outdoor storage system at the Mosaic Fertilizer plant in Riverview, releasing 65 million gallons of acidic, nutrient-rich process water into Archie Creek Canal, Hillsborough Bay, and surrounding wetlands.
Mosaic Fertilizer, LLC is the world’s largest producer of concentrated phosphate and potash, which are used to manufacture plant fertilizer. Phosphorus is an essential nutrient for plants. Yet its original form, calcium phosphate derived from phosphate rock, is not water-soluble and therefore cannot be absorbed by plants. Getting it into a water-soluble form is accomplished by treating it with sulfuric acid to create phosphoric acid. The by-product from that conversion is mostly calcium sulfate but goes by the name “phosphogypsum.”
Phosphogypsum starts out as slurry when it is first stored in outdoor containment units. Over time, as the slurry is piled higher and higher, immense stacks are created with sloped sides of phosphogypsum and open-air ponds at the top. Acidic process water is stored and recycled from the top of the stack through the phosphate production facility. If the berms that contain the acidic, nutrient rich ponds at the top of the stack fail, as they did in the wake of Hurricane Frances, they pose a threat to human health and the environment.
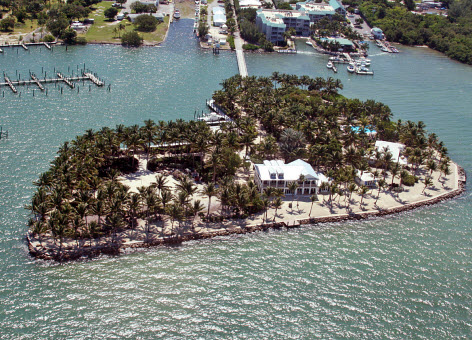
The pollution released from the Mosaic Fertilizer plant in 2004 harmed nearly 10 acres of seagrass beds and more than 135 acres of wetland habitats, including nearly 80 acres of mangroves. The acidic water dramatically lowered pH, directly killing thousands of fish, crabs and bottom-dwelling organisms. The influx of nitrogen and phosphorous also disrupted the local ecosystem, potentially injuring fish and other aquatic wildlife.
NOAA and State trustees worked with Mosaic Fertilizer, LLC to assess these environmental injuries and restore the site. In 2013 and 2014, Mosaic implemented restoration projects to compensate for the environmental injuries that the process water spill caused. Restoration included the removal of invasive exotic plants, widening and improving tidal creeks and increasing through 85 acres of mangrove forest, constructing a 3500‘ oyster reef, and creating an oligohaline or brackish tidal wetland. Mosaic is now monitoring the health of the restored natural areas, with NOAA and our partners providing oversight.
From Illegal Dump to Wetland Bonus
Not far from the Mosaic Fertilizer plant, a five acre parcel of low-lying land pocked with sinkholes had produced its own pollution woes for wetlands. Located on Raleigh Street, battery casings, furnace slag, trash, and construction debris were dumped at this site from 1977 to 1991.
By 2009, the level of pollution was deemed dire enough to land it on the U.S. Environmental Protection Agency’s National Priorities List, slating it for cleanup under the Superfund law. Years of illegal dumping had left the area filled with contaminated soil, sediment, and groundwater.
EPA investigations at the site found a number of chemical contaminants posing an unacceptable risk to human health and the environment, including oil-related compounds and heavy metals such as antimony, arsenic, and lead.
Cleanup and restoration activities at the Raleigh Street Dump Site were comprehensive and involved replacing contaminated soils with clean soils, removing contaminated sediments, planting grass, restoring wetland areas, and reducing the concentration of contaminants in the groundwater. NOAA has worked closely with EPA over the years to ensure the cleanup at Raleigh Street Dump Site was protective of the environment. By the end, restoration actually resulted in an increase of wetland area at the site, more than doubling it to 2.6 acres.
The restoration work done at the Mosaic Fertilizer and Raleigh Street sites is just part of a larger overall conservation effort in a region that for decades had been experiencing environmental decline. According to the Tampa Bay Estuary Program, a regional alliance of local, state, and federal government partners dedicated to the area’s health, the Tampa Bay area has made “a remarkable comeback in recent years, with impressive gains in water quality, seagrass recovery, and fish and wildlife populations.” NOAA is happy to have a part in making this a reality.
")
Oligohaline or brackish tidal wetland, created at the Mosaic fertilizer site in Riverview, FL. (NOAA)
Site Themes:
Node Weight:
1
")
")
")
")
")
")
")
")
")
")
")
")
")
")
")
")
")
")
")
")
")
")

")